Tyson Foods 2008 Annual Report Download - page 13
Download and view the complete annual report
Please find page 13 of the 2008 Tyson Foods annual report below. You can navigate through the pages in the report by either clicking on the pages listed below, or by using the keyword search tool below to find specific information within the annual report.-
 1
1 -
2
-
 3
3 -
 4
4 -
 5
5 -
 6
6 -
 7
7 -
 8
8 -
 9
9 -
 10
10 -
 11
11 -
 12
12 -
 13
13 -
 14
14 -
 15
15 -
 16
16 -
 17
17 -
 18
18 -
 19
19 -
 20
20 -
 21
21 -
 22
22 -
 23
23 -
24
-
25
-
26
-
27
-
28
-
29
-
30
-
31
-
32
-
33
-
34
-
35
-
36
-
37
-
38
-
39
-
40
-
41
-
42
-
43
-
44
-
45
-
46
-
47
-
48
-
49
-
50
-
51
-
52
-
53
-
54
-
55
-
56
-
57
-
58
-
59
-
60
-
61
-
62
-
63
-
64
-
65
-
66
-
67
-
68
-
69
-
70
-
71
-
72
 |
 |

11 2008 Annual Report
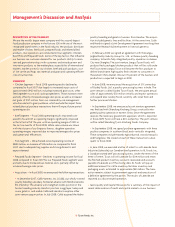
Management’s Discussion and Analysis (continued)
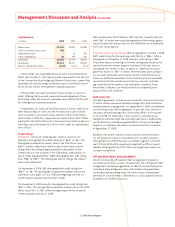
in millions, except per share data 2008 2007 2006
Net income (loss) $ 86 $ 268 $ (196)
Net income (loss) per diluted share 0.24 0.75 (0.58)
2008
Net income includes the following items:
• $33 million of charges related to asset impairments, including
packaging equipment, intangible assets, unimproved real property
and software;
• $17 million charge related to restructuring our Emporia, Kansas,
beef operation;
• $13 million charge related to closing our Wilkesboro, North
Carolina, Cooked Products poultry plant;
• $13 million of charges related to fl ood damage at our Jefferson,
Wisconsin, plant and severance charges related to the FAST
initiative; and
• $18 million non-operating gain related to sale of an investment.
2007
Net income includes the following item:
• $17 million of tax expense related to a fi xed asset tax cost correc-
tion, primarily related to a fi xed asset system conversion in 1999.
2006
Net loss includes the following items:
• $63 million of costs related to beef, prepared foods and poultry
plant closings;
• $19 million of charges related to our Cost Management Initiative
and other business consolidation efforts which included severance
expense, product rationalization costs and related intangible asset
impairment expenses;
• $15 million tax expense resulting from a review of our tax account
balances; and
• $5 million charge related to the cumulative effect of a change
in accounting principle due to adoption of Financial Accounting
Standards Board Interpretation No. 47, “Accounting for Conditional
Asset Retirement Obligations,” an interpretation of FASB Statement
No. 143 (FIN 47).
OUTLOOK
The following elements comprise our long-term strategic plan:
• Create innovative and insight-driven food solutions: Discover and
sell market-leading products and services to grow Tyson’s brand
equity and help our customers succeed through our commitment
to joint value creation.
• Optimize commodity business models: Emphasize cost focus in
operations, manage margins and maximize revenue by capitalizing
on scale, yield, pricing, product mix and services.
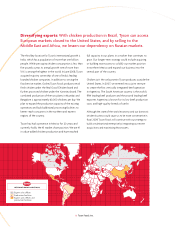
• Build a multi-national enterprise: Accelerate expansion in cost
competitive regions and markets with the greatest growth potential
as well as increase and diversify United States exports.
• Revolutionize conversion of raw materials and by-products into
high-margin initiatives: Commercialize opportunities outside the core
business, such as renewable energy from fat and developing other
technologically-advanced platforms from materials such as feathers,
viscera, blood and animal waste.
Our outlook for segments in fi scal 2009 includes:
• Chicken – Export markets, credit availability and the recent
strengthening dollar have negatively impacted leg quarter pricing.
International leg quarter sales will be diffi cult at least through the
beginning of fi scal 2009. We have seen grain prices drop signifi cantly
from all-time highs this past summer that if sustained, will benefi t us
in the long run. However, we have some grain positions that could
negatively impact us depending on corn and soybean meal closing
prices at the end of the fi rst quarter fi scal 2009.
• Beef – We expect cattle supplies will be down 1 – 2% in fi scal
2009, but there should be ample supply to run our plants effi ciently.
We will continue to focus on the operational effi ciencies from fi scal
2008 and expect a successful fi scal 2009.
• Pork – While we anticipate fewer hog supplies in fi scal 2009, we
expect we will have an adequate supply to achieve good operating
results. This segment should continue to do well in fi scal 2009, but
likely not at the record amounts we had in fi scal 2008.
• Prepared Foods – High input costs will likely continue in fi scal
2009. Demand for our products remains strong, which should provide
for sales volume growth in fi scal 2009.