Sara Lee 2013 Annual Report Download - page 8
Download and view the complete annual report
Please find page 8 of the 2013 Sara Lee annual report below. You can navigate through the pages in the report by either clicking on the pages listed below, or by using the keyword search tool below to find specific information within the annual report.-
 1
1 -
 2
2 -
 3
3 -
 4
4 -
 5
5 -
 6
6 -
 7
7 -
 8
8 -
 9
9 -
 10
10 -
 11
11 -
 12
12 -
 13
13 -
 14
14 -
 15
15 -
 16
16 -
 17
17 -
 18
18 -
 19
19 -
20
-
21
-
22
-
23
-
24
-
25
-
26
-
27
-
28
-
29
-
30
-
31
-
32
-
33
-
34
-
35
-
36
-
37
-
38
-
39
-
40
-
41
-
42
-
43
-
44
-
45
-
46
-
47
-
48
-
49
-
50
-
51
-
52
-
53
-
54
-
55
-
56
-
57
-
58
-
59
-
60
-
61
-
62
-
63
-
64
-
65
-
66
-
67
-
68
 |
 |

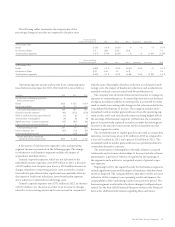
6The Hillshire Brands Company
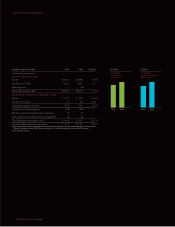
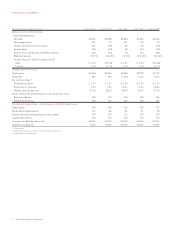
FINANCIAL SUMMARY
Dollars in millions except per share data June 29, 2013 June 30, 2012 July 2, 2011 July 3, 20101 June 27, 2009
RESULTS OF OPERATIONS
Continuing operations
Net sales $3,920 $3,958 $3,884 $3,842 $4,023
Operating income 297 76 227 175 95
Income (loss) before income taxes 256 (35) 85 59 (37)
Income (loss) 184 (20) 58 124 (31)
Income (loss) attributable to Hillshire Brands 184 (20) 58 124 (31)
Effective tax rate 28.1% (44.2)fi 31.8% (111.7)fi (16.5)fi
Income (loss) per share of common stock2
Basic $÷1.50 $«(0.16) $÷0.47 $÷0.90 $«(0.22)
Diluted 1.49 (0.16) 0.46 0.90 (0.22)
FINANCIAL POSITION
Total assets $2,434 $2,450 $9,482 $8,778 $9,376
Total debt 951 944 2,109 2,247 2,247
Per common share2
Dividends declared $÷0.50 $÷1.15 $÷2.30 $÷2.20 $÷2.20
Book value at year-end 3.93 1.95 16.12 11.00 14.42
Market value at year-end 33.08 28.99 96.60 69.95 47.90
Shares used in the determination of net income per share2
Basic (in millions) 123 119 124 138 140
Diluted (in millions) 123 119 125 138 140
OTHER INFORMATION – CONTINUING OPERATIONS ONLY
Depreciation 146 162 116 133 127
Media advertising expense 113 86 81 91 58
Total media advertising and promotion expense 174 136 121 143 106
Capital expenditures 139 173 138 175 136
Common stockholders of record348,000 52,000 60,000 64,000 67,000
Number of employees 9,100 9,500 10,000 10,000 11,000
1 53-week year.
2 Reflects the impact of a 1-for-5 reverse stock split in June 2012.
3 As of the latest practicable date.