Sara Lee 2013 Annual Report Download - page 11
Download and view the complete annual report
Please find page 11 of the 2013 Sara Lee annual report below. You can navigate through the pages in the report by either clicking on the pages listed below, or by using the keyword search tool below to find specific information within the annual report.-
 1
1 -
 2
2 -
 3
3 -
 4
4 -
 5
5 -
 6
6 -
 7
7 -
 8
8 -
 9
9 -
 10
10 -
 11
11 -
 12
12 -
 13
13 -
 14
14 -
 15
15 -
 16
16 -
 17
17 -
 18
18 -
 19
19 -
 20
20 -
 21
21 -
 22
22 -
23
-
24
-
25
-
26
-
27
-
28
-
29
-
30
-
31
-
32
-
33
-
34
-
35
-
36
-
37
-
38
-
39
-
40
-
41
-
42
-
43
-
44
-
45
-
46
-
47
-
48
-
49
-
50
-
51
-
52
-
53
-
54
-
55
-
56
-
57
-
58
-
59
-
60
-
61
-
62
-
63
-
64
-
65
-
66
-
67
-
68
 |
 |

The Hillshire Brands Company 9
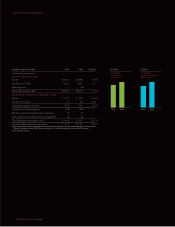
NET SALES
Net sales in 2013 were $3.920 billion, a decrease of $38 million, or
1.0% versus 2012. Net sales were impacted by dispositions after the
beginning of 2012, which reduced net sales by $55 million. Adjusted
net sales increased $17 million, or 0.4% due to a 1.4% increase in
volumes, which were only partially offset by an unfavorable shift in
sales mix and pricing actions in response to lower commodity costs.
Sales were negatively impacted by a material one-time reduction in
inventory levels held by a large retail customer in the fourth quarter
of 2013 and issues with the lunchmeat packaging transition.
Net sales in 2012 were $3.958 billion, an increase of $74 million,
or 1.9% versus 2011. Net sales were impacted by dispositions after the
beginning of 2011, which reduced net sales by $80 million. Adjusted
net sales increased $154 million, or 4.1% due to price increases in
response to higher commodity costs and the year-over-year impact
of an acquisition made in 2011, partially offset by lower volumes.
OPERATING INCOME
Operating income increased by $221 million in 2013. The year-
over-year net impact of the change in significant items and business
dispositions identified in the preceding table of consolidated results
decreased operating income by $181 million. As a result, adjusted
operating income increased $40 million, or 12.5% due to a significant
decline in general corporate expense, excluding significant items,
lower commodity costs net of pricing actions and higher volumes,
partially offset by increased investments in MAP spending.
Operating income decreased by $151 million, or 66.5% in 2012
from 2011. The year-over-year net impact of the change in significant
items and the business dispositions identified in the preceding table
of consolidated results decreased operating income by $159 million.
As a result, adjusted operating income increased $8 million, or 2.5%
due to a significant decline in general corporate expense, excluding
significant items, partially offset by lower adjusted operating results
in the Foodservice/Other business segment.
The changes in the individual components of operating income
are discussed in more detail below.
GROSS MARGIN
The gross margin, which represents net sales less cost of sales,
increased by $61 million in 2013. The increase was driven by the
impact of lower commodity costs and the benefits of cost saving
initiatives. These were only partially offset by a negative shift in
sales mix, higher bakery manufacturing costs and the generally
weak economic conditions in the foodservice category.
The gross margin percentage increased from 27.8% in 2012
to 29.6% in 2013 due to gross margin percentage increases in
the Retail segment. The gross margin percentage was positively
impacted by lower commodity costs partially offset by higher
bakery manufacturing costs.
The gross margin decreased by $62 million in 2012 from 2011,
driven by the negative impact of higher discounts associated with
aged inventories, lower volumes, the negative impact of disruptions
associated with the Tarboro N.C. bakery plant upgrade and the gen-
erally weak economic conditions in the foodservice category, which
were only partially offset by the benefits of cost saving initiatives.
The gross margin percentage decreased from 29.9% in 2011
to 27.8% in 2012 due to gross margin percentage declines for all
business segments but primarily at Foodservice/Other. The gross
margin percentage was negatively impacted by higher commodity
costs, lower volumes and higher discounts associated with aged
inventories which were partially offset by pricing actions and
continuous improvement savings.
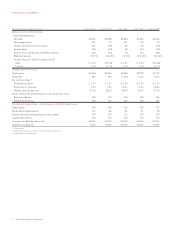
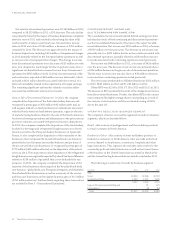
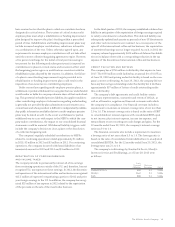
SELLING, GENERAL AND ADMINISTRATIVE EXPENSES
In millions 2013 2012 2011
SG&A expenses in the business
segment results
Media advertising and promotion $174 $136 $121
Other 597 594 623
Total business segments 771 730 744
Amortization of identifiable intangibles 444
General corporate expenses 81 195 136
Mark-to-market derivative
(gains)/losses (1) 1 (1)
Total SG&A $855 $930 $883
Total SG&A expenses reported in 2013 by the business segments
increased by $41 million, or 5.6%, versus 2012 primarily due to
higher MAP spending.
Unallocated general corporate expenses decreased by $114 million
in 2013 over the prior year due to a $86 million decrease in charges
related to restructuring actions, costs incurred in conjunction with
the spin-off and other significant items as well as the impact of
headcount reductions, lower benefit plan expenses and a reduction
in information technology costs.