Sara Lee 2013 Annual Report Download - page 36
Download and view the complete annual report
Please find page 36 of the 2013 Sara Lee annual report below. You can navigate through the pages in the report by either clicking on the pages listed below, or by using the keyword search tool below to find specific information within the annual report.-
 1
1 -
2
-
3
-
4
-
5
-
6
-
7
-
8
-
9
-
10
-
11
-
12
-
13
-
14
-
15
-
16
-
17
-
18
-
19
-
20
-
21
-
22
-
23
-
24
-
25
-
 26
26 -
 27
27 -
 28
28 -
 29
29 -
 30
30 -
 31
31 -
 32
32 -
 33
33 -
 34
34 -
 35
35 -
 36
36 -
 37
37 -
 38
38 -
 39
39 -
 40
40 -
 41
41 -
 42
42 -
 43
43 -
 44
44 -
 45
45 -
 46
46 -
47
-
48
-
49
-
50
-
51
-
52
-
53
-
54
-
55
-
56
-
57
-
58
-
59
-
60
-
61
-
62
-
63
-
64
-
65
-
66
-
67
-
68
 |
 |

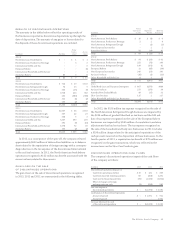
34 The Hillshire Brands Company
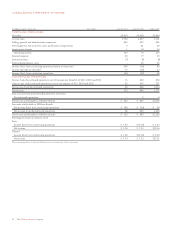
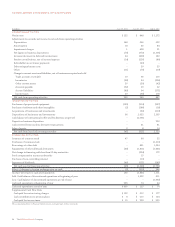
CONSOLIDATED STATEMENTS OF CASH FLOWS
In millions June 29, 2013 June 30, 2012 July 2, 2011
OPERATING ACTIVITIES
Net income $«252 $÷÷848 $«1,272
Adjustments to reconcile net income to net cash from operating activities
Depreciation 148 266 302
Amortization 18 46 84
Impairment charges 1 428 21
Net (gain) on business dispositions (75) (772) (1,305)
Increase (decrease) in deferred income taxes 44 (400) 180
Pension contributions, net of income/expense (14) (226) (80)
Refundable tax on Senseo payments – (43) –
Debt extinguishment costs –3955
Other (11) (70) (19)
Change in current assets and liabilities, net of businesses acquired and sold
Trade accounts receivable 19 66 116
Inventories (38) 34 (206)
Other current assets 30 (30) (42)
Accounts payable (52) 29 62
Accrued liabilities (89) 94 (171)
Income taxes 20 (60) 178
Net cash from operating activities 253 249 447
INVESTING ACTIVITIES
Purchases of property and equipment (135) (314) (337)
Purchase of software and other intangibles (5) (188) (18)
Acquisitions of businesses and investments – (30) (119)
Dispositions of businesses and investments 96 2,033 2,305
Cash balance of International Coffee and Tea business at spin-off – (2,061) –
Deposit on business disposition – – 203
Cash received from (used in) derivative transactions –3181
Sales of assets 3814
Net cash from (used in) investing activities (41) (521) 2,129
FINANCING ACTIVITIES
Issuances of common stock 47 84 52
Purchases of common stock – – (1,313)
Borrowings of other debt – 851 1,054
Repayments of other debt and derivatives (46) (1,811) (1,431)
Net change in financing with less than 90-day maturities – (204) 172
Stock compensation income tax benefits –15 –
Purchase of non-controlling interest – (10) –
Payments of dividends (46) (271) (285)
Net cash used in financing activities (45) (1,346) (1,751)
Effect of changes in foreign exchange rates on cash (2) (213) 286
Increase (decrease) in cash and equivalents 165 (1,831) 1,111
Add: Cash balance of discontinued operations at beginning of year – 1,992 911
Less: Cash balance of discontinued operations at end of year – – (1,992)
Cash and equivalents at beginning of year 235 74 44
Cash and equivalents at end of year $«400 $÷÷235 $«÷÷«74
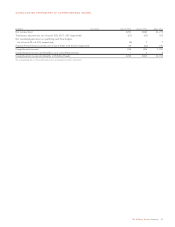
Supplemental Cash Flow Data
Cash paid for restructuring charges $«102 $÷÷512 $««««177
Cash contributions to pension plans $÷÷«8 $÷÷213 $««««124
Cash paid for income taxes $÷«15 $÷÷209 $««««325
The accompanying Notes to Financial Statements are an integral part of these statements.