Sara Lee 2013 Annual Report Download - page 13
Download and view the complete annual report
Please find page 13 of the 2013 Sara Lee annual report below. You can navigate through the pages in the report by either clicking on the pages listed below, or by using the keyword search tool below to find specific information within the annual report.-
 1
1 -
2
-
 3
3 -
 4
4 -
 5
5 -
 6
6 -
 7
7 -
 8
8 -
 9
9 -
 10
10 -
 11
11 -
 12
12 -
 13
13 -
 14
14 -
 15
15 -
 16
16 -
 17
17 -
 18
18 -
 19
19 -
 20
20 -
 21
21 -
 22
22 -
 23
23 -
24
-
25
-
26
-
27
-
28
-
29
-
30
-
31
-
32
-
33
-
34
-
35
-
36
-
37
-
38
-
39
-
40
-
41
-
42
-
43
-
44
-
45
-
46
-
47
-
48
-
49
-
50
-
51
-
52
-
53
-
54
-
55
-
56
-
57
-
58
-
59
-
60
-
61
-
62
-
63
-
64
-
65
-
66
-
67
-
68
 |
 |

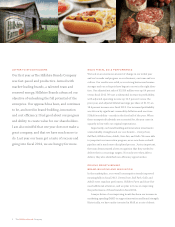
The Hillshire Brands Company 11
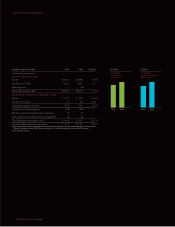
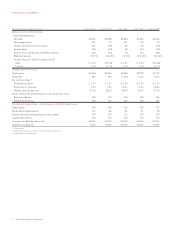
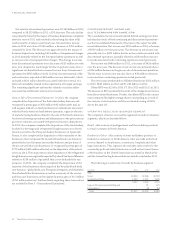
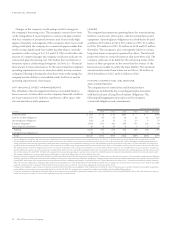
INCOME TAX EXPENSE
The effective tax rate on continuing operations in 2013, 2012 and
2011 was impacted by a number of significant items that are shown
in the reconciliation of the company’s effective tax rate to the U.S.
statutory rate in Note 18 – Income Taxes. Additional information
regarding income taxes can be found in “Critical Accounting Estimates”
within Management’s Discussion and Analysis.
In millions 2013 2012 2011
Continuing operations
Income (loss) before income taxes $«256 $÷«(35) $«÷85
Income tax expense (benefit) 72 (15) 27
Effective tax rates 28.1% (44.2)fi 31.8%
2013 versus 2012 In 2013, the company recognized a tax expense
for continuing operations of $72 million, or an effective tax rate of
28.1%, compared to tax benefit of $15 million, or an effective tax rate
of 44.2%, in 2012. The tax rate in 2013 was impacted by contingent
tax obligations, deductions associated with domestic production
activities, non-taxable indemnification agreements, employee benefit
deductions and tax provision adjustments. See the tax rate reconcili-
ation table in Note 18 – Income Taxes for additional information.
2012 versus 2011 In 2012, the company recognized a tax benefit
on continuing operations of $15 million, or an effective tax rate of
44.2%, compared to tax expense of $27 million, or an effective tax
rate of 31.8%, in 2011. The tax rate in 2012 was impacted by non-
taxable indemnification agreements, employee benefit deductions
and tax provision adjustments partially offset by non-deductible
professional fees. See the tax rate reconciliation table in Note 18 –
Income Taxes for additional information.
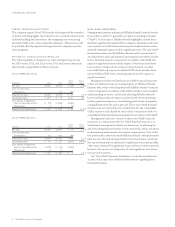
INCOME (LOSS) FROM CONTINUING OPERATIONS
AND DILUTED EARNINGS PER SHARE (EPS)
FROM CONTINUING OPERATIONS
Income from continuing operations in 2013 was $184 million,
an increase of $204 million over the prior year. The improvement
was due to a $165 million decrease in net after tax charges incurred
in conjunction with the spin-off, restructuring actions and other
significant items. Loss from continuing operations in 2012 was
$20 million, a decrease of $78 million over the prior year. The decline
was due to net after tax charges incurred in conjunction with the
spin-off, restructuring actions and other significant items.
Diluted EPS from continuing operations was $1.49 in 2013, a
loss of $0.16 in 2012 and income of $0.46 in 2011. Adjusted diluted
EPS was $1.72 in 2013, $1.45 in 2012 and $1.21 in 2011. The diluted
EPS from continuing operations in the current year is unfavorably
impacted by higher average shares outstanding as a result of the
exercise of stock options and the accelerated vesting of RSUs due
to the spin-off.
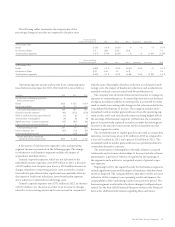
DISCONTINUED OPERATIONS
The results of the company’s North American fresh bakery,
refrigerated dough and foodservice beverage businesses and the
international coffee and tea, household and body care and European
and Australian bakery businesses, which have been classified as
discontinued operations, are summarized below. See Note 1 – Nature
of Operations and Basis of Presentation for additional information.
In millions 2013 2012 2011
Net sales $«80 $5,365 $8,223
Income (loss) from discontinued
operations before income taxes $÷«7 $÷(140) $÷«565
Income tax (expense) benefit on income
from discontinued operations 8 603 (82)
Gain on disposition of discontinued
operations before income taxes 68 772 1,304
Income tax expense on disposition
of discontinued operations (15) (367) (573)
Net income from discontinued operations $«68 $÷«868 $1,214
Net Sales and Income (Loss) from Discontinued Operations before
Income Taxes Net sales for discontinued operations were $80 million
in 2013, compared to $5.365 billion in 2012. The year-over-year
change was due to the completion of the disposition of most of the
businesses that were part of the discontinued operations prior to
the end of 2012. The net sales in 2013 all relate to the Australian
bakery operations, which were disposed of in February 2013. Income
from discontinued operations was $15 million in 2013, a decline of
$448 million compared to 2012 as a result of the completion of the
disposition of most of the businesses that were part of discontinued
operations. The year-over-year change was also impacted by the
nonrecurrence of significant impairment charges and tax benefits
that were recognized in 2012, as discussed in more detail below. The
operating results reported in 2013 relate to the Australian bakery
operations, as well as adjustments of prior year tax provision estimates
related to the business dispositions completed in 2012.