Sara Lee 2013 Annual Report Download - page 6
Download and view the complete annual report
Please find page 6 of the 2013 Sara Lee annual report below. You can navigate through the pages in the report by either clicking on the pages listed below, or by using the keyword search tool below to find specific information within the annual report.
FINANCIAL HIGHLIGHTS
4The Hillshire Brands Company
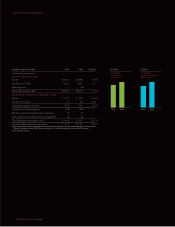
In millions except per share data 2013 2012 % Change
Continuing operations
ADJUSTED NET SALES
Retail $2,894 $2,884 0.3fi
Foodservice/Other 1,026 1,025 0.1
Intersegment – (6)
Total adjusted net sales1$3,920 $3,903 0.4fi
ADJUSTED OPERATING INCOME (LOSS)
Retail $÷«329 $÷«313 5.5fi
Foodservice/Other 75 79 (5.0)
Operating segment income 404 392 3.4fi
General corporate expenses (36) (64)
Mark-to-market derivatives gains/(losses) (1) (1)
Amortization of trademarks and intangibles (4) (4)
Total adjusted operating income1$÷«363 $÷«323 12.5fi
Adjusted diluted earnings per share $÷1.72 $÷1.45 18.6fi
1 Adjusted amounts are non-GAAP financial measures. See detailed explanation of non-GAAP measures
in the Financial Review.
In millions
ADJUSTED
OPERATING
INCOME
2012 2013
323
363
In dollars
ADJUSTED
DILUTED EARNINGS
PER SHARE
2012 2013
1.45
1.72

