Sara Lee 2013 Annual Report Download - page 59
Download and view the complete annual report
Please find page 59 of the 2013 Sara Lee annual report below. You can navigate through the pages in the report by either clicking on the pages listed below, or by using the keyword search tool below to find specific information within the annual report.-
 1
1 -
2
-
3
-
4
-
5
-
6
-
7
-
8
-
9
-
10
-
11
-
12
-
13
-
14
-
15
-
16
-
17
-
18
-
19
-
20
-
21
-
22
-
23
-
24
-
25
-
26
-
27
-
28
-
29
-
30
-
31
-
32
-
33
-
34
-
35
-
36
-
37
-
38
-
39
-
40
-
41
-
42
-
43
-
44
-
45
-
46
-
47
-
48
-
 49
49 -
 50
50 -
 51
51 -
 52
52 -
 53
53 -
 54
54 -
 55
55 -
 56
56 -
 57
57 -
 58
58 -
 59
59 -
 60
60 -
 61
61 -
 62
62 -
 63
63 -
 64
64 -
 65
65 -
 66
66 -
 67
67 -
 68
68
 |
 |

The Hillshire Brands Company 57
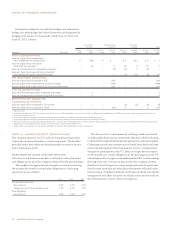
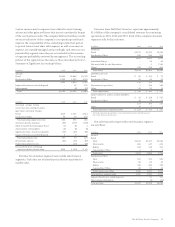
NOTE 18 – INCOME TAXES
The provisions for income taxes on continuing operations computed
by applying the U.S. statutory rate to income from continuing opera-
tions before taxes as reconciled to the actual provisions were:
2013 2012 2011
Income (loss) from continuing
operations before income taxes
United States 99.7fi (97.9)fi 99.5fi
Foreign 0.3fi (2.1)fi 0.5fi
Total 100.0fi (100.0)fi 100.0fi
Tax expense (benefit) at U.S. statutory rate 35.0fi (35.0)fi 35.0fi
State income taxes 2.1fi 0.4fi 2.6fi
Finalization of tax reviews and audits and
changes in estimate on tax contingencies (2.1) (2.3) 4.0
Domestic production deduction (1.6) – (3.8)
Employee benefit deductions (1.5) (8.5) (4.6)
Non-taxable indemnification agreements (1.7) (22) –
Non-deductible professional fees 0.2 28.9 3.5
Tax provision adjustments (1.6) (6.5) (4.8)
Other, net (0.7) 0.8 (0.1)
Taxes at effective worldwide tax rates 28.1fi (44.2)fi 31.8fi
The tax expense related to continuing operations increased
$87 million in 2013 due primarily to an increase in pretax income
from continuing operations of $291 million offset by $15 million
of year-over-year increases in tax benefits for the items noted in
the table above. The increase in tax benefits relate primarily to the
release of certain contingent tax obligations after statutes in multi-
ple jurisdictions lapsed and certain tax regulatory examinations and
reviews were resolved, an increase in deductions associated with
domestic production activities, and a decrease in the amount of
non-deductible professional fees offset by a decrease in non-taxable
indemnification income.
The tax expense related to continuing operations decreased
$42 million in 2012 due primarily to a decline in pretax income
from continuing operations of $120 million.
The tax expense related to continuing operations increased
$92 million in 2011. The increase in tax expense in 2011 was due
primarily to the year-over-year impact of a net tax benefit reported
in 2010 that included a $90 million tax benefit for the release of
certain contingent tax obligations after statutes in multiple jurisdic-
tions lapsed and certain tax regulatory examinations and reviews
were resolved.
The company intends to continue to reinvest all of its earnings
outside of the U.S. and, therefore, has not recognized U.S. tax expense
on these earnings. U.S. federal income tax and withholding tax on
these foreign unremitted earnings would be immaterial.
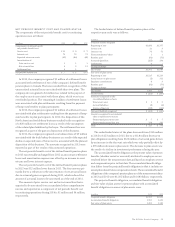
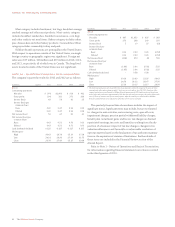
Current and deferred tax provisions (benefits) were:
In millions 2013 2012 2011
Current Deferred Current Deferred Current Deferred
U.S. $27 $38 $(17) $«2 $(6) $29
Foreign ––––1–
State 3 4 3 (3) 5 (2)
$30 $42 $(14) $(1) $«– $27
Cash payments for income taxes from continuing operations were
$12 million in 2013, $26 million in 2012 and $36 million in 2011.
Hillshire Brands and eligible subsidiaries file a consolidated U.S.
federal income tax return. The company uses the asset-and-liability
method to provide income taxes on all transactions recorded in the
consolidated financial statements. This method requires that income
taxes reflect the expected future tax consequences of temporary
differences between the carrying amounts of assets or liabilities for
book and tax purposes. Accordingly, a deferred tax liability or asset
for each temporary difference is determined based upon the tax
rates that the company expects to be in effect when the underlying
items of income and expense are realized. The company’s expense
for income taxes includes the current and deferred portions of that
expense. A valuation allowance is established to reduce deferred
tax assets to the amount the company expects to realize.
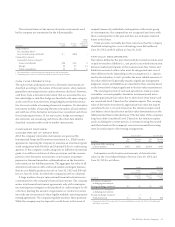
The deferred tax liabilities (assets) at the respective year-ends
were as follows:
In millions 2013 2012
Deferred tax (assets)
Pension liability $÷(52) $÷(73)
Employee benefits (90) (113)
Nondeductible reserves (54) (63)
Net operating loss and other tax carryforwards (51) (49)
Other (28) (16)
Gross deferred tax (assets) (275) (314)
Less valuation allowances 58 60
Net deferred tax (assets) (217) (254)
Deferred tax liabilities
Property, plant and equipment 93 69
Intangibles 33 35
Deferred tax liabilities 126 104
Total net deferred tax liabilities $÷(91) $(150)
There are state net operating losses of $51 million that begin to
expire in 2014 through 2032.