Sara Lee 2013 Annual Report Download - page 62
Download and view the complete annual report
Please find page 62 of the 2013 Sara Lee annual report below. You can navigate through the pages in the report by either clicking on the pages listed below, or by using the keyword search tool below to find specific information within the annual report.-
 1
1 -
2
-
3
-
4
-
5
-
6
-
7
-
8
-
9
-
10
-
11
-
12
-
13
-
14
-
15
-
16
-
17
-
18
-
19
-
20
-
21
-
22
-
23
-
24
-
25
-
26
-
27
-
28
-
29
-
30
-
31
-
32
-
33
-
34
-
35
-
36
-
37
-
38
-
39
-
40
-
41
-
42
-
43
-
44
-
45
-
46
-
47
-
48
-
49
-
50
-
51
-
 52
52 -
 53
53 -
 54
54 -
 55
55 -
 56
56 -
 57
57 -
 58
58 -
 59
59 -
 60
60 -
 61
61 -
 62
62 -
 63
63 -
 64
64 -
 65
65 -
 66
66 -
 67
67 -
 68
68
 |
 |

60 The Hillshire Brands Company
NOTES TO FINANCIAL STATEMENTS
Meat category includes lunchmeat, hot dogs, breakfast sausage,
smoked sausage and other meat products. Meat-centric category
includes breakfast sandwiches, breakfast convenience, corn dogs
and other ready to eat meal items. Bakery category includes cakes,
pies, cheesecakes and other bakery products. Commodities/Other
category includes commodity turkey and pork.
Hillshire Brands operations are principally in the United States.
With respect to operations outside of the United States, no single
foreign country or geographic region was significant. Foreign net
sales were $17 million, $18 million and $19 million in 2013, 2012,
and 2011, respectively, all of which was in Canada. The long-lived
assets located outside of the United States are not significant.
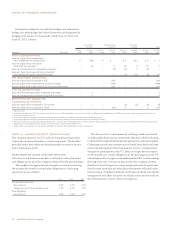
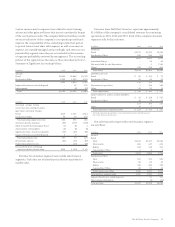
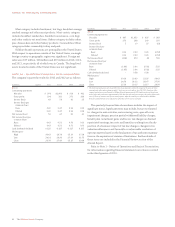
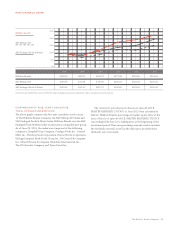
NOTE 20 – QUARTERLY FINANCIAL DATA (UNAUDITED)
The company’s quarterly results for 2013 and 2012 are as follows:
In millions Quarter First Second Third Fourth
2013
Continuing operations
Net sales $÷«974 $1,060 $÷«924 $÷«962
Gross profit 294 332 272 264
Income (loss) 49 58 42 35
Income (loss) per
common share
Basic 0.40 0.47 0.34 0.29
Diluted 0.40 0.47 0.34 0.28
Net income (loss) 53 65 93 41
Net income (loss) per
common share
Basic 0.43 0.53 0.76 0.33
Diluted 0.43 0.53 0.75 0.33
Cash dividends declared 0.125 0.125 0.125 0.125
Market price
High 30.43 28.74 35.19 37.28
Low 24.31 24.96 27.30 31.75
Close 26.78 27.49 35.15 33.08
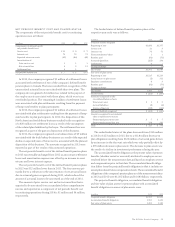
In millions Quarter First Second Third Fourth
2012
Continuing operations
Net sales $÷«987 $1,053 $÷«935 $÷«983
Gross profit 273 298 260 270
Income (loss) 5 10 27 (62)
Income (loss) per
common share
Basic 0.04 0.09 0.23 (0.52)
Diluted 0.04 0.09 0.23 (0.52)
Net income (loss) (218) 470 (3) 599
Net income (loss) per
common share
Basic (1.86) 3.96 (0.02) 5.02
Diluted (1.85) 3.94 (0.02) 5.02
Cash dividends declared – 0.58 0.58 –
Market price1
High 30.39 29.69 33.95 34.43
Low 24.54 24.12 28.67 27.56
Close 25.19 29.15 33.17 28.99
1 The historical market prices for fiscal 2012 have been adjusted to reflect the impact of the spin-off of the
international coffee and tea business and a 1-for-5 reverse stock split on June 28, 2012. A portion of the
original market price was allocated to Hillshire Brands (approximately 30%) and a portion to the interna-
tional coffee and tea business (approximately 70%) based on the same percentages to be used to allocate the
cost of a share of common stock for tax basis purposes. After the market price attributable to Hillshire
Brands was determined, it was adjusted to reflect the 1-for-5 reverse stock split.
The quarterly financial data shown above includes the impact of
significant items. Significant items may include, but are not limited
to: charges for exit activities; restructuring costs; spin-off costs;
impairment charges; pension partial withdrawal liability charges;
benefit plan curtailment gains and losses; tax charges on deemed
repatriated earnings; tax costs and benefits resulting from the dis-
position of a business; impact of tax law changes; changes in tax
valuation allowances and favorable or unfavorable resolution of
open tax matters based on the finalization of tax authority examina-
tions or the expiration of statutes of limitations. Further details of
these items are included in the Financial Review section of the
Annual Report.
Refer to Note 1 – Nature of Operations and Basis of Presentation,
for information regarding financial statement corrections recorded
in the third quarter of 2013.