Sara Lee 2013 Annual Report Download - page 45
Download and view the complete annual report
Please find page 45 of the 2013 Sara Lee annual report below. You can navigate through the pages in the report by either clicking on the pages listed below, or by using the keyword search tool below to find specific information within the annual report.-
 1
1 -
2
-
3
-
4
-
5
-
6
-
7
-
8
-
9
-
10
-
11
-
12
-
13
-
14
-
15
-
16
-
17
-
18
-
19
-
20
-
21
-
22
-
23
-
24
-
25
-
26
-
27
-
28
-
29
-
30
-
31
-
32
-
33
-
34
-
 35
35 -
 36
36 -
 37
37 -
 38
38 -
 39
39 -
 40
40 -
 41
41 -
 42
42 -
 43
43 -
 44
44 -
 45
45 -
 46
46 -
 47
47 -
 48
48 -
 49
49 -
 50
50 -
 51
51 -
 52
52 -
 53
53 -
 54
54 -
 55
55 -
56
-
57
-
58
-
59
-
60
-
61
-
62
-
63
-
64
-
65
-
66
-
67
-
68
 |
 |

The Hillshire Brands Company 43
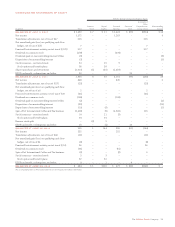
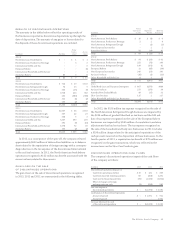
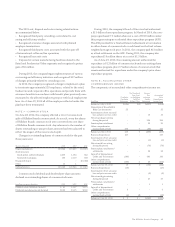
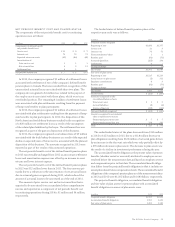
RESULTS OF DISCONTINUED OPERATIONS
The amounts in the tables below reflect the operating results of
the businesses reported as discontinued operations up through the
date of disposition. The amounts of any gains or losses related to
the disposal of these discontinued operations are excluded.
Pretax
Income Income
In millions Net Sales (Loss) (Loss)
2013
North American Fresh Bakery $÷÷÷«– $÷÷«1 $÷÷«1
North American Foodservice Beverage –32
International Coffee and Tea ––6
European Bakery – – (3)
International Household and Body Care ––1
Australian Bakery 8038
Total $÷÷«80 $÷÷«7 $÷«15
2012
North American Fresh Bakery $÷«724 $÷«29 $«163
North American Refrigerated Dough 74 13 9
North American Foodservice Beverage 330 (15) (9)
International Coffee and Tea 3,728 224 662
European Bakery 262 (384) (358)
International Household and Body Care 111 (5) (2)
Australian Bakery 136 (2) (2)
Total $5,365 $(140) $«463
2011
North American Fresh Bakery $2,037 $÷«58 $«159
North American Refrigerated Dough 307 42 27
North American Foodservice Beverage 53853
International Coffee and Tea 3,537 399 276
European Bakery 591 (9) (16)
International Household and Body Care 1,078 72 36
Australian Bakery 135 (2) (2)
Total $8,223 $«565 $«483
In 2012, as a consequence of the spin-off, the company released
approximately $623 million of deferred tax liabilities on its balance
sheet related to the repatriation of foreign earnings with a correspon-
ding reduction in the tax expense of the discontinued international
coffee and tea business. In 2011, the North American fresh bakery
operations recognized a $122 million tax benefit associated with the
excess tax basis related to these assets.
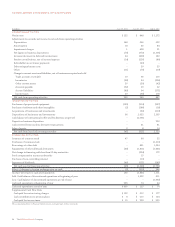
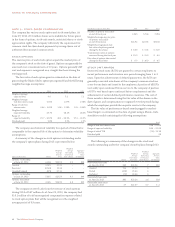
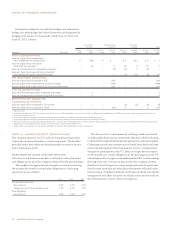
GAIN (LOSS) ON THE SALE
OF DISCONTINUED OPERATIONS
The gain (loss) on the sale of discontinued operations recognized
in 2013, 2012 and 2011 are summarized in the following tables.
Pretax Tax
Gain (Loss) (Expense)/ After Tax
In millions on Sale Benefit Gain (Loss)
2013
North American Fresh Bakery $÷÷«10 $÷÷(4) $÷÷6
North American Foodservice Beverage 224
North American Refrigerated Dough – (1) (1)
Non-European Insecticides –22
Australian Bakery 56 (14) 42
Total $÷÷«68 $÷(15) $÷53
2012
North American Fresh Bakery $÷÷«94 $÷(33) $÷61
North American Foodservice Beverage 222 (76) 146
North American Refrigerated Dough 198 (156) 42
European Bakery 11 (45) (34)
Non-European Insecticides 249 (59) 190
Air Care Products (10) (1) (11)
Other Household and Body Care 8311
Total $÷«772 $(367) $405
2011
Global Body Care and European Detergents $÷«867 $(379) $488
Air Care Products 273 (179) 94
Australia/New Zealand Bleach 48 (17) 31
Shoe Care Products 115 2 117
Other Household and Body Care Businesses 1–1
Total $1,304 $(573) $731
In 2012, the $156 million tax expense recognized on the sale of
the North American Refrigerated Dough business was impacted by
the $254 million of goodwill that had no tax basis and the $45 mil-
lion of tax expense recognized on the sale of the European Bakery
businesses was impacted by $140 million of cumulative translation
adjustments that had no tax basis. The tax expense recognized on
the sale of the household and body care businesses in 2011 includes
a $190 million charge related to the anticipated repatriation of the
cash proceeds received on the disposition of these businesses. In the
fourth quarter of 2011, a repatriation tax benefit of $79 million was
recognized on the gain transactions, which was reflected in the
income taxes on the Shoe Care Products gain.
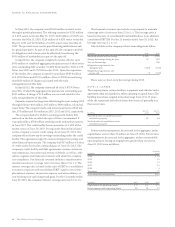
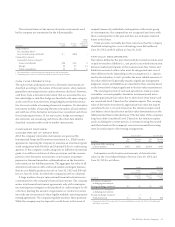
DISCONTINUED OPERATIONS CASH FLOWS
The company’s discontinued operations impacted the cash flows
of the company as follows:
In millions 2013 2012 2011
Discontinued operations impact on
Cash from operating activities $«10 $÷÷122 $÷÷309
Cash from (used in) investing activities 86 (368) 2,291
Cash used in financing activities (95) (1,530) (1,804)
Effect of changes in foreign
exchange rates on cash (1) (216) 285
Net cash impact of
discontinued operations $÷«– $(1,992) $«1,081
Cash balance of discontinued operations
At start of period $÷«– $«1,992 $÷÷911
At end of period – – 1,992
Increase (decrease) in cash
of discontinued operations $÷«– $(1,992) $«1,081