Sara Lee 2013 Annual Report Download - page 49
Download and view the complete annual report
Please find page 49 of the 2013 Sara Lee annual report below. You can navigate through the pages in the report by either clicking on the pages listed below, or by using the keyword search tool below to find specific information within the annual report.-
 1
1 -
2
-
3
-
4
-
5
-
6
-
7
-
8
-
9
-
10
-
11
-
12
-
13
-
14
-
15
-
16
-
17
-
18
-
19
-
20
-
21
-
22
-
23
-
24
-
25
-
26
-
27
-
28
-
29
-
30
-
31
-
32
-
33
-
34
-
35
-
36
-
37
-
38
-
 39
39 -
 40
40 -
 41
41 -
 42
42 -
 43
43 -
 44
44 -
 45
45 -
 46
46 -
 47
47 -
 48
48 -
 49
49 -
 50
50 -
 51
51 -
 52
52 -
 53
53 -
 54
54 -
 55
55 -
 56
56 -
 57
57 -
 58
58 -
 59
59 -
60
-
61
-
62
-
63
-
64
-
65
-
66
-
67
-
68
 |
 |

The Hillshire Brands Company 47
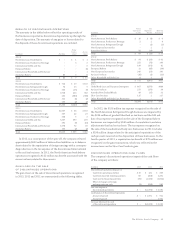
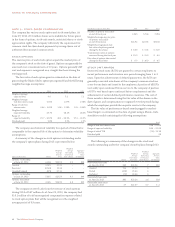
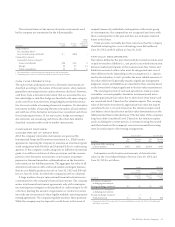
As of June 29, 2013, the company had $12 million of total
unrecognized compensation expense related to stock unit plans that
will be recognized over the weighted average period of 1.8 years.
In millions except per share data 2013 2012 2011
Stock Unit Awards
Fair value of share-based units
that vested during the fiscal year $÷÷÷«4 $«÷÷88 $«÷÷42
Weighted average grant date
fair value of share based units
granted during the fiscal year $25.02 $29.09 $23.40
All Stock-Based Compensation
Total compensation expense $÷÷«13 $«÷÷35 $«÷÷41
Tax benefit on compensation expense $÷÷÷«5 $÷«÷11 $÷«÷15
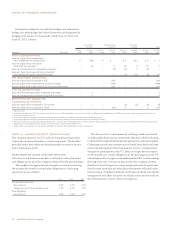
NOTE 10 – EMPLOYEE STOCK OWNERSHIP PLANS (ESOP)
The company maintains an ESOP that holds common stock of the
company that is used to fund a portion of the company’s matching
program for its 401(k) savings plan for domestic non-union employ-
ees. The purchase of the original stock by the ESOP was funded both
with debt guaranteed by the company and loans from the company.
The debt guaranteed by the company was fully paid in 2004 and only
loans from the company to the ESOP remain. Each year, the company
makes contributions that, with the dividends on the common stock
held by the ESOP, are used to pay loan interest and principal. Shares
are allocated to participants based upon the ratio of the current year’s
debt service to the sum of the total principal and interest payments
over the remaining life of the loan. The number of unallocated
shares in the ESOP was 3 million at June 29, 2013 and 5 million at
June 30, 2012. Expense recognition for the ESOP is accounted for
under the grandfathered provisions contained within US GAAP.
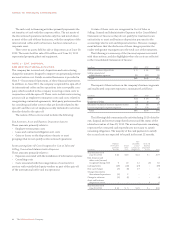
The expense for the 401(k) savings plan recognized by the ESOP
amounted to $5 million in 2013, $14 million in 2012 and $15 million
in 2011. Payments to the ESOP were $10 million in 2013, $6 million
in 2012 and $23 million in 2011.
NOTE 11 – EARNINGS PER SHARE
Net income (loss) per share – basic is computed by dividing income
(loss) attributable to Hillshire Brands by the weighted average number
of common shares outstanding for the period. Net income (loss)
per share – diluted reflects the potential dilution that could occur
if options and fixed awards to be issued under stock-based compen-
sation arrangements were converted into common stock.
Options to purchase 2.2 million shares of common stock at
June 29, 2013, 847 thousand shares of common stock at June 30,
2012 and 6.2 million shares of common stock at July 2, 2011 were
not included in the computation of diluted earnings per share because
these options were either anti-dilutive or the exercise price was
greater than the average market price of the company’s outstanding
common stock. In 2012, the dilutive effect of stock options and
award plans were excluded from the earnings per share calculation
because they would be antidilutive given the loss in the period.
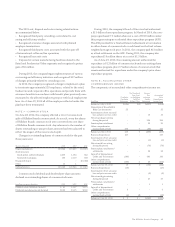
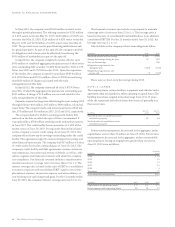
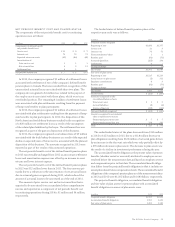
The following is a reconciliation of net income to net income
per share – basic and diluted – for the years ended June 29, 2013,
June 30, 2012 and July 2, 2011:
In millions except earnings per share 2013 2012 2011
Income (loss) from continuing operations
attributable to Hillshire Brands $«184 $÷«(20) $÷÷«58
Net income from discontinued operations
attributable to Hillshire Brands 68 865 1,205
Net income attributable to Hillshire Brands $«252 $÷845 $1,263
Average shares outstanding – basic 123 119 124
Dilutive effect of stock compensation ––1
Diluted shares outstanding 123 119 125
Income (loss) per common share – Basic
Income (loss) from continuing operations $1.50 $(0.16) $÷0.47
Income from discontinued operations 0.55 7.29 9.69
Net income $2.05 $«7.13 $10.16
Income (loss) per common share – Diluted
Income (loss) from continuing operations $1.49 $(0.16) $÷0.46
Income from discontinued operations 0.55 7.29 9.65
Net income $2.04 $«7.13 $10.11
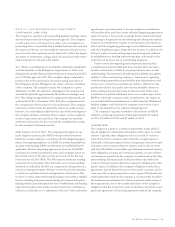
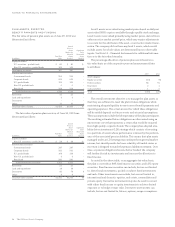
NOTE 12 – DEBT INSTRUMENTS
The composition of the company’s long-term debt, which includes
capital lease obligations, is summarized in the following table:
In millions Maturity Date 2013 2012
Senior debt
10% zero coupon notes
($19 million face value) 2014 $÷18 $÷16
10% – 14.25% zero coupon notes
($105 million face value) 2015 93 82
2.75% notes 2016 400 400
4.1% notes 2021 278 278
6.125% notes 2033 152 152
Total senior debt 941 928
Obligations under capital lease –2
Other debt 11 15
Total debt 952 945
Unamortized discounts (1) (1)
Total long-term debt 951 944
Less current portion (19) (5)
$932 $939