Sara Lee 2013 Annual Report Download - page 16
Download and view the complete annual report
Please find page 16 of the 2013 Sara Lee annual report below. You can navigate through the pages in the report by either clicking on the pages listed below, or by using the keyword search tool below to find specific information within the annual report.-
 1
1 -
2
-
3
-
4
-
5
-
 6
6 -
 7
7 -
 8
8 -
 9
9 -
 10
10 -
 11
11 -
 12
12 -
 13
13 -
 14
14 -
 15
15 -
 16
16 -
 17
17 -
 18
18 -
 19
19 -
 20
20 -
 21
21 -
 22
22 -
 23
23 -
 24
24 -
 25
25 -
 26
26 -
27
-
28
-
29
-
30
-
31
-
32
-
33
-
34
-
35
-
36
-
37
-
38
-
39
-
40
-
41
-
42
-
43
-
44
-
45
-
46
-
47
-
48
-
49
-
50
-
51
-
52
-
53
-
54
-
55
-
56
-
57
-
58
-
59
-
60
-
61
-
62
-
63
-
64
-
65
-
66
-
67
-
68
 |
 |

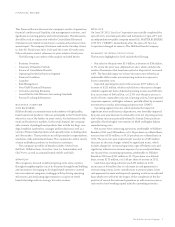
2013 versus 2012 Net sales increased by $10 million or 0.3% due
to a favorable shift in sales mix partially offset by price decreases in
an environment of lower commodity costs and slightly lower volumes.
Volumes declined 0.1% as volume increases for Jimmy Dean break-
fast sandwiches and sausages, and Aidells specialty sausages were
offset by a one-time material change in fourth quarter inventory levels
held by a large retail customer, softness in Hillshire Farm lunchmeat
and declining volumes for Ball Park hot dogs, sweet goods, and
Sara Lee deli meats. Pricing actions decreased sales by 0.2%.
Operating segment income, which excludes the impact of
restructuring charges and other significant items, increased $16 mil-
lion, or 5.5%. The increase was due to lower commodities costs
net of pricing actions and a favorable shift in sales mix, which was
partially offset by increased manufacturing and SG&A expenses.
MAP investments increased driven by higher spending behind certain
core brands and new products, notably Jimmy Dean and Ball Park.
2012 versus 2011 Net sales increased by $124 million or 4.5%
due to an acquisition made in May 2011, pricing actions and an
improved sales mix, which offset the negative impact of lower vol-
umes, discounts to move aged inventory and higher slotting costs.
The acquisition increased net sales by 3.8 percentage points, while
the pricing actions, which were taken to offset higher commodity
costs, increased net sales by 4.6 percentage points. Unit volumes
declined 3.8%, excluding the impact of acquisitions, due to lower
volumes for frozen bakery products, hot dogs, breakfast sandwiches,
deli meats, lunchmeats and smoked sausages which more than
offset volume increases for breakfast sausages.
Operating segment income decreased $1 million, or 0.6%. The
decrease in operating segment income was the result of the impact
of lower volumes, discounts to move aged inventory, higher slotting
expenses and higher MAP and distribution costs which were only
partially offset by the favorable income impact of an acquisition made
in May 2011, lower SG&A costs, positive pricing to commodities,
and savings from continuous improvement programs.
14 The Hillshire Brands Company
FINANCIAL REVIEW
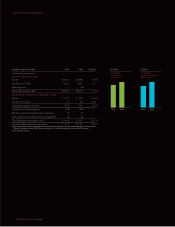
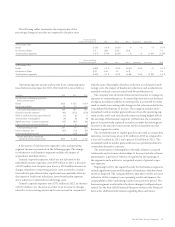
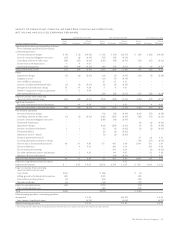
RETAIL
Dollar Percent Dollar Percent
In millions 2013 2012 Change Change 2012 2011 Change Change
Net sales $2,894 $2,884 $10 0.3% $2,884 $2,760 $124 4.5fi
Operating segment income $÷«329 $÷«313 $16 5.5% $÷«313 $÷«314 $÷«(1) (0.6)fi