Sara Lee 2013 Annual Report Download - page 18
Download and view the complete annual report
Please find page 18 of the 2013 Sara Lee annual report below. You can navigate through the pages in the report by either clicking on the pages listed below, or by using the keyword search tool below to find specific information within the annual report.-
 1
1 -
2
-
3
-
4
-
5
-
6
-
7
-
 8
8 -
 9
9 -
 10
10 -
 11
11 -
 12
12 -
 13
13 -
 14
14 -
 15
15 -
 16
16 -
 17
17 -
 18
18 -
 19
19 -
 20
20 -
 21
21 -
 22
22 -
 23
23 -
 24
24 -
 25
25 -
 26
26 -
 27
27 -
 28
28 -
29
-
30
-
31
-
32
-
33
-
34
-
35
-
36
-
37
-
38
-
39
-
40
-
41
-
42
-
43
-
44
-
45
-
46
-
47
-
48
-
49
-
50
-
51
-
52
-
53
-
54
-
55
-
56
-
57
-
58
-
59
-
60
-
61
-
62
-
63
-
64
-
65
-
66
-
67
-
68
 |
 |

16 The Hillshire Brands Company
FINANCIAL REVIEW
FINANCIAL CONDITION
The company’s cash flow statements include amounts related to
discontinued operations through the date of disposal. The discon-
tinued operations had an impact on the cash flows from operating,
investing and financing activities in each fiscal year.
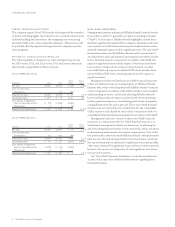
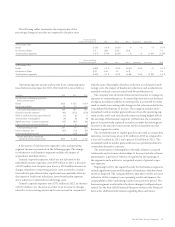
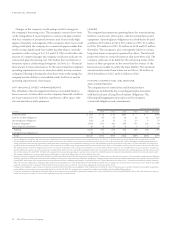
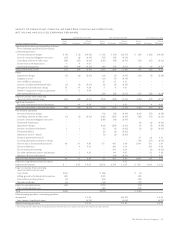
CASH FROM OPERATING ACTIVITIES
The cash from operating activities generated by continuing and
discontinued operations is summarized in the following table:
2013 2012 2011
Cash from operating activities
Continuing operations $243 $127 $138
Discontinued operations 10 122 309
Total $253 $249 $447
2013 versus 2012 The increase in cash from operating activities
of $4 million in 2013 was due to a $410 million decrease in cash
paid for restructuring actions, a $205 million decrease in pension
contributions, a $194 million decrease in cash taxes paid, as well as
improved operating results on an adjusted basis. These increases in
cash generated from operations were offset by the completion of
business dispositions in the prior fiscal year as well as an increase
in cash used to fund operating activities.
2012 versus 2011 The decrease in cash from operating activities
of $198 million in 2012 was due to the completion of business
dispositions prior to the end of 2012 and a $335 million increase in
cash paid for restructuring actions as well as an $89 million increase
in pension contributions. These uses of cash were partially offset
by improved operating results on an adjusted basis, better working
capital management and a reduction in cash taxes paid.
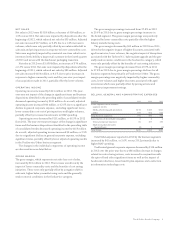
CASH FROM (USED IN) INVESTING ACTIVITIES
The cash from (used in) investing activities generated by continuing
and discontinued operations is summarized in the following table:
2013 2012 2011
Cash from (used in) investing activities
Continuing operations $(127) $(153) $÷(162)
Discontinued operations 86 (368) 2,291
Total $÷(41) $(521) $2,129
2013 versus 2012 In 2013, $41 million of cash was used in invest-
ing activities compared with $521 million in 2012. The decrease in
cash used was primarily due to a $179 million decrease in cash paid
for property and equipment, a $183 million decline in cash paid for
software and other intangibles and a $124 million increase in net
cash proceeds received related to business dispositions.
The company spent $135 million in 2013 for the purchase
of property and equipment as compared to $314 in 2012, which
included $158 million related to discontinued operations. The
year-over-year decline related to continuing operations was due
primarily to the higher expenditures in 2012 related to expanded
meat production capacity.
Capital expenditures for property and equipment related to
continuing operations for 2013 was $134 million. In 2014 the company
expects such expenditures to equal approximately 4% of net sales.
The cash paid for the purchase of software and other intangibles
declined by $183 million as the prior year included a $153 million
payment to acquire the remaining ownership interest in the Senseo
coffee trademark, which was subsequently transferred to DEMB as
part of the spin-off.
The company received $96 million on the disposition of businesses
in 2013, of which approximately $85 million (82 million AUD) was
received upon the disposition of its Australian bakery business. In
2012, business dispositions resulted in a net use of cash of $28 million
as the $2.033 billion of cash received from various business disposi-
tions was offset by $2.061 billion of cash transferred as part of the
spin-off. The $30 million of expenditures for business acquisitions
in 2012 related to beverage companies that were subsequently
transferred to DEMB as part of the spin-off.
2012 versus 2011 In 2012, $521 million of cash was used in investing
activities while in 2011, $2.129 billion of cash was received from
investing activities. The decrease in cash generated by investing
activities was due to $2.061 billion of cash transferred as part of the
spin-off of the international coffee and tea business; a $475 million
decline in the cash received from business dispositions, including the
deposit received in 2011; and an increase in cash paid for software
and other intangibles, which is primarily related to the $153 million
(€115 million) paid to acquire the remaining ownership interest
in the Senseo coffee trademark. In addition, $31 million of cash
was received from derivative transactions in 2012, which related
primarily to hedges of foreign currency exposures, as compared to
$81 million in 2011.
The company received $2.033 billion on the disposition
of businesses in 2012 related primarily to the disposition of its
North American fresh bakery, refrigerated dough and foodservice
beverage businesses and its international bakery businesses. In 2011,
the company received $2.3 billion related to the disposition of the
majority of the international household and body care business
and also received a $203 million deposit related to the disposition
of its insecticides business that closed in the first half of 2012.