Sara Lee 2013 Annual Report Download - page 14
Download and view the complete annual report
Please find page 14 of the 2013 Sara Lee annual report below. You can navigate through the pages in the report by either clicking on the pages listed below, or by using the keyword search tool below to find specific information within the annual report.-
 1
1 -
2
-
3
-
 4
4 -
 5
5 -
 6
6 -
 7
7 -
 8
8 -
 9
9 -
 10
10 -
 11
11 -
 12
12 -
 13
13 -
 14
14 -
 15
15 -
 16
16 -
 17
17 -
 18
18 -
 19
19 -
 20
20 -
 21
21 -
 22
22 -
 23
23 -
 24
24 -
25
-
26
-
27
-
28
-
29
-
30
-
31
-
32
-
33
-
34
-
35
-
36
-
37
-
38
-
39
-
40
-
41
-
42
-
43
-
44
-
45
-
46
-
47
-
48
-
49
-
50
-
51
-
52
-
53
-
54
-
55
-
56
-
57
-
58
-
59
-
60
-
61
-
62
-
63
-
64
-
65
-
66
-
67
-
68
 |
 |

12 The Hillshire Brands Company
FINANCIAL REVIEW
Net sales for discontinued operations were $5.365 billion in 2012,
compared to $8.223 billion in 2011, a 35% decrease. The sales decline
was primarily driven by the impact of business dispositions completed
after the start of 2011 and resulted in there being less than a full
twelve months of sales in each fiscal year. Income before income
taxes in 2012 was a loss of $140 million, a decrease of $705 million
compared to 2011. The decrease was again driven by the impact of
business dispositions including $414 million of impairment charges
in 2012 primarily related to the European bakery operations as well
as various restructuring and other charges. The change in income
from discontinued operations was a decrease of $20 million over the
prior year despite the much larger decline in pretax income due to
significant tax benefits that increased income from discontinued
operations by $685 million in 2012. In 2012, the international coffee
and tea business reported a $438 million income tax benefit, which
included a $623 million benefit associated with the reversal of a
deferred tax liability related to the repatriation of foreign earnings.
The remaining significant tax benefits related to tax basis differ-
ences and tax settlements and reserve reversals.
Gain on Sale of Discontinued Operations In 2013, the company
completed the disposition of the Australian bakery business and
recognized a pretax gain of $56 million ($42 million after tax), as
well as gains related to a final purchase price adjustment associated
with the North American fresh bakery operation, a gain on the sale
of manufacturing facilities related to the sale of the North American
foodservice beverage operations and adjustments to the prior year tax
provision estimates associated with previous business dispositions.
In 2012, the company completed the disposition of the fresh bakery,
foodservice beverage and refrigerated dough businesses in North
America as well as the European bakery businesses in Spain and
France. It also completed the disposition of the remainder of the
businesses that comprised the household and body care business,
primarily the non-European insecticides business and portions of
the air care and shoe care businesses. It recognized a pretax gain of
$772 million ($405 million after tax) on the disposition of these busi-
nesses in 2012. The tax provision on the disposition of the refrigerated
dough business was negatively impacted by a book/tax basis difference
related to $254 million of goodwill that is not deductible for tax
purposes. In 2011, the company completed the disposition of the
majority of the businesses that comprised the household and body
care business – global body care, European detergents, and Australia/
New Zealand bleach businesses as well as a majority of the air care
and shoe care businesses and recognized a pretax gain of $1.3 billion
($731 million after tax). Further details regarding these transactions
are included in Note 5 – Discontinued Operations.
CONSOLIDATED NET INCOME AND
DILUTED EARNINGS PER SHARE (EPS)
The consolidated net income and related diluted earnings per share
includes the results of both continuing and discontinued operations –
see the Consolidated Statements of Income in this report for addi-
tional information. Net income was $252 million in 2013, a decrease
of $596 million over the prior year. The decrease in net income was
primarily due to a $800 million decline in the results associated with
discontinued operations, partially offset by a $204 million increase
in results associated with continuing operations noted previously.
Net income was $848 million in 2012, a decrease of $424 million
over the prior year. The decrease in net income was primarily due to
a $326 million decrease in the gain on sale of discontinued operations.
The decrease in net income was also due to a $78 million reduction
in income from continuing operations noted previously.
The net income attributable to Hillshire Brands was $252 million
in 2013, $845 million in 2012 and $1.263 billion in 2011.
Diluted EPS were $2.04 in 2013, $7.13 in 2012 and $10.11 in 2011.
The decrease in EPS is primarily the result of the change in net income
from discontinued businesses. Further, the diluted EPS in the current
year is impacted by higher average shares outstanding as a result of
the exercise of stock options and the accelerated vesting of RSUs
due to the spin-off.
OPERATING RESULTS BY BUSINESS SEGMENT
The company’s structure is currently organized around two business
segments, which are described below:
Retail sells a variety of packaged meat and frozen bakery products
to retail customers in North America.
Foodservice/Other sells a variety of meat and bakery products to
foodservice customers in North America. Sales are made in the food-
service channel to distributors, restaurants, hospitals and other
large institutions. This segment also includes sales results for the
commodity pork and turkey businesses as well as the former Senseo
coffee business in the United States that was exited in March 2012
and the former live hog business that was exited in September 2011.
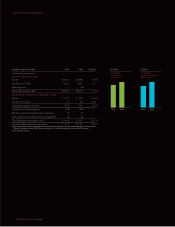
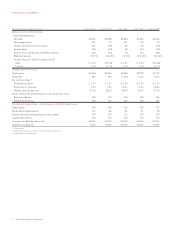
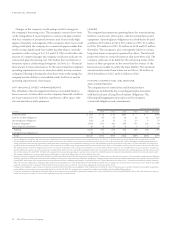
The following is a summary of results by business segment:
In millions 2013 2012 2011
Sales
Retail $2,894 $2,884 $2,760
Foodservice/Other 1,026 1,025 1,001
3,920 3,909 3,761
Impact of businesses exited/disposed – 55 135
Intersegment – (6) (12)
Total $3,920 $3,958 $3,884