Sara Lee 2013 Annual Report Download - page 53
Download and view the complete annual report
Please find page 53 of the 2013 Sara Lee annual report below. You can navigate through the pages in the report by either clicking on the pages listed below, or by using the keyword search tool below to find specific information within the annual report.-
 1
1 -
2
-
3
-
4
-
5
-
6
-
7
-
8
-
9
-
10
-
11
-
12
-
13
-
14
-
15
-
16
-
17
-
18
-
19
-
20
-
21
-
22
-
23
-
24
-
25
-
26
-
27
-
28
-
29
-
30
-
31
-
32
-
33
-
34
-
35
-
36
-
37
-
38
-
39
-
40
-
41
-
42
-
 43
43 -
 44
44 -
 45
45 -
 46
46 -
 47
47 -
 48
48 -
 49
49 -
 50
50 -
 51
51 -
 52
52 -
 53
53 -
 54
54 -
 55
55 -
 56
56 -
 57
57 -
 58
58 -
 59
59 -
 60
60 -
 61
61 -
 62
62 -
 63
63 -
64
-
65
-
66
-
67
-
68
 |
 |

The Hillshire Brands Company 51
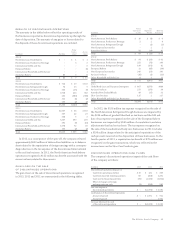
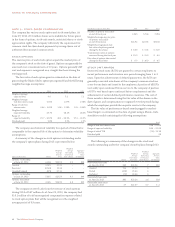
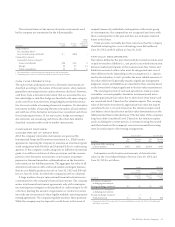
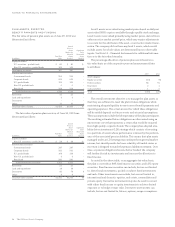
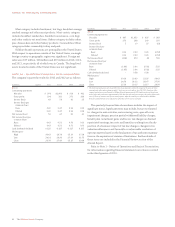
The notional values of the various derivative instruments used
by the company are summarized in the following table:
Hedge
Coverage
June 29, June 30, (Number of
In millions 2013 2012 Months)
Swap contracts
Rec. fixed/pay fixed –
cross currency swaps notional1$÷– $(40) –
Commodity contracts
Commodity future contracts2
Grains and oilseeds $34 $«56 5
Energy 29 27 11
Other commodities 20 25 6
1 The notional value is calculated using the exchange rates as the reporting date.
2 Commodity futures contracts are determined by the notional cost of the contract.
CASH FLOW PRESENTATION
The cash receipts and payments from a derivative instrument are
classified according to the nature of the instrument, when realized,
generally in investing activities unless otherwise disclosed. However,
cash flows from a derivative instrument that are accounted for as a
fair value hedge or cash flow hedge are classified in the same category
as the cash flows from the items being hedged provided the deriva-
tive does not include a financing element at inception. If a derivative
instrument includes a financing element at inception, all cash inflows
and outflows of the derivative instrument are considered cash flows
from financing activities. If, for any reason, hedge accounting is
discontinued, any remaining cash flows after that date shall be
classified consistent with mark-to-market instruments.
CONTINGENT FEATURES/
CONCENTRATION OF CREDIT RISK
All of the company’s derivative instruments are governed by
International Swaps and Derivatives Association (i.e., ISDA) master
agreements, requiring the company to maintain an investment grade
credit rating from both Moody’s and Standard & Poor’s credit rating
agencies. If the company’s credit rating were to fall below investment
grade, it would be in violation of these provisions, and the counter-
parties to the derivative instruments could request immediate
payment or demand immediate collateralization on the derivative
instruments in net liability positions. The aggregate fair value of all
derivative instruments with credit-risk-related contingent features
that are in a liability position was nil on June 29, 2013 and $40 mil-
lion on June 30, 2012, for which the company posted no collateral.
A large number of major international financial institutions are
counterparties to the company’s financial instruments. The company
enters into financial instrument agreements only with counterpar-
ties meeting very stringent credit standards (a credit rating of A-/A3
or better), limiting the amount of agreements or contracts it enters
into with any one party and, where legally available, executing master
netting agreements. The company regularly monitors these positions.
While the company may be exposed to credit losses in the event of
nonperformance by individual counterparties of the entire group
of counterparties, the company has not recognized any losses with
these counterparties in the past and does not anticipate material
losses in the future.
Trade accounts receivable due from customers that the company
identified as having low or no credit ratings were $60 million at
June 29, 2013 and $52 million at June 30, 2012.
FAIR VALUE MEASUREMENTS
Fair value is defined as the price that would be received to sell an asset
or paid to transfer a liability (i.e., exit price) in an orderly transaction
between market participants at the measurement date. Assets and
liabilities measured at fair value must be categorized into one of
three different levels depending on the assumptions (i.e., inputs)
used in the valuation. Level 1 provides the most reliable measure of
fair value while level 3 generally requires significant management
judgment. Assets and liabilities are classified in their entirety based
on the lowest level of input significant to the fair value measurement.
The carrying amounts of cash and equivalents, trade accounts
receivables, accounts payable, derivative instruments and notes
payable approximate fair values due to their short-term nature and
are considered Level 1 based on the valuation inputs. The carrying
value of derivative instruments approximate fair value but may be
considered Level 1 or Level 2 based on the valuation inputs used
(see balance sheet classification and fair value determination in the
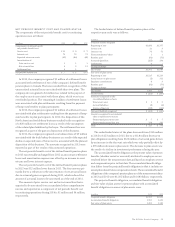
table presented later in this disclosure.) The fair value of the company’s
long-term debt (considered Level 2 based on the valuation inputs
used), including the current portion, is estimated using discounted
cash flows based on the company’s current incremental borrowing
rates for similar types of borrowing arrangements.
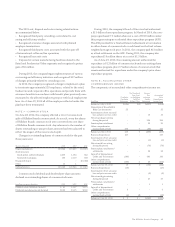
June 29, 2013 June 30, 2012
Fair Carrying Fair Carrying
In millions Value Amount Value Amount
Long-term debt, including
current portion $981 $951 $1,004 $945
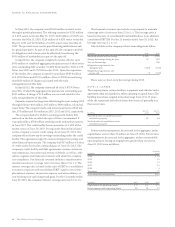
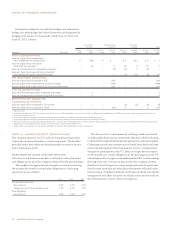
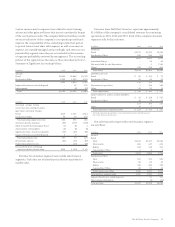
Information on the location and amounts of derivative fair
values in the Consolidated Balance Sheet at June 29, 2013 and
June 30, 2012 is as follows:
Assets Liabilities
Other Accrued
Current Assets Liabilities – Other
June 29, June 30, June 29, June 30,
In millions 2013 2012 2013 2012
Derivatives designated
as hedging instruments
Foreign exchange contracts1$– $– $– $40
Derivatives not designated
as hedging instruments
Foreign exchange contracts1–1––
Total derivatives $– $1 $– $40
1 Categorized as level 2: Fair value of level 2 assets and liabilities as of June 30, 2012 are $1 million and
$40 million, respectively.