Sara Lee 2013 Annual Report Download - page 61
Download and view the complete annual report
Please find page 61 of the 2013 Sara Lee annual report below. You can navigate through the pages in the report by either clicking on the pages listed below, or by using the keyword search tool below to find specific information within the annual report.-
 1
1 -
2
-
3
-
4
-
5
-
6
-
7
-
8
-
9
-
10
-
11
-
12
-
13
-
14
-
15
-
16
-
17
-
18
-
19
-
20
-
21
-
22
-
23
-
24
-
25
-
26
-
27
-
28
-
29
-
30
-
31
-
32
-
33
-
34
-
35
-
36
-
37
-
38
-
39
-
40
-
41
-
42
-
43
-
44
-
45
-
46
-
47
-
48
-
49
-
50
-
 51
51 -
 52
52 -
 53
53 -
 54
54 -
 55
55 -
 56
56 -
 57
57 -
 58
58 -
 59
59 -
 60
60 -
 61
61 -
 62
62 -
 63
63 -
 64
64 -
 65
65 -
 66
66 -
 67
67 -
 68
68
 |
 |
The Hillshire Brands Company 59
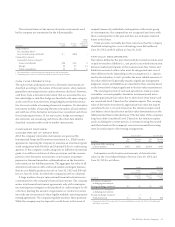
various income and/or expense items related to restructuring
actions and other gains and losses that are not considered to be part
of the core business results. The company believes that these results
are more indicative of the company’s core operating results and
improve the comparability of the underlying results from period
to period. Interest and other debt expense, as well as income tax
expense, are centrally managed, and accordingly, such items are not
presented by segment since they are not included in the measure
of segment profitability reviewed by management. The accounting
policies of the segments are the same as those described in Note 2 –
Summary of Significant Accounting Policies.
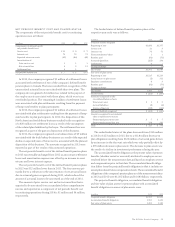
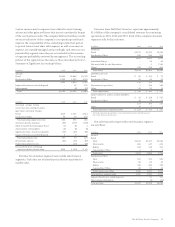
In millions 2013 2012 2011
SALES
Retail $2,894 $2,884 $2,760
Foodservice/Other 1,026 1,025 1,001
3,920 3,909 3,761
Impact of businesses exited/disposed – 55 135
Intersegment – (6) (12)
Total $3,920 $3,958 $3,884
In millions 2013 2012 2011
INCOME (LOSS) FROM
CONTINUING OPERATIONS
BEFORE INCOME TAXES
Retail $329 $«313 $«314
Foodservice/Other 75 79 102
Total operating segment income 404 392 416
General corporate expenses (93) (272) (159)
Mark-to-market derivative gain/(loss) (1) (1) 2
Amortization of intangibles (4) (4) (4)
Significant items – business segments (15) (47) (31)
Impact of businesses exited/disposed 683
Total operating income 297 76 227
Net interest expense (41) (72) (87)
Debt extinguishment costs – (39) (55)
Income (loss) from continuing
operations before income taxes $256 $÷(35) $÷«85
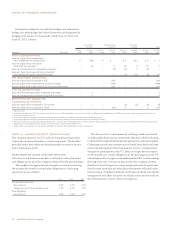
Net sales for a business segment may include sales between
segments. Such sales are at transfer prices that are equivalent to
market value.
Revenues from Wal-Mart Stores Inc. represent approximately
$1.0 billion of the company’s consolidated revenues for continuing
operations in 2013, 2012 and 2011. Each of the company’s business
segments sells to this customer.
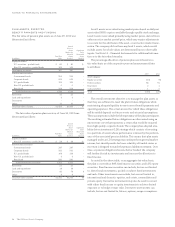
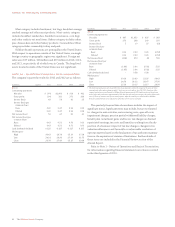
In millions 2013 2012 2011
ASSETS
Retail $1,273 $1,279 $1,282
Foodservice/Other 542 530 530
1,815 1,809 1,812
Australian Bakery –5866
Net assets held for sale/disposition – 5 7,143
Other1619 578 461
Total assets $2,434 $2,450 $9,482
DEPRECIATION
Retail $÷«÷90 $÷«101 $÷÷«79
Foodservice/Other 28 30 26
118 131 105
Discontinued operations 2 104 186
Other 28 31 11
Total depreciation $÷«148 $÷«266 $÷«302
ADDITIONS TO LONG-LIVED ASSETS
Retail $÷÷«95 $÷«128 $÷«207
Foodservice/Other 28 38 28
123 166 235
Other 1672
Total additions to long-lived assets $÷«139 $÷«173 $÷«237
1 Principally cash and cash equivalents, certain corporate fixed assets, deferred tax assets
and certain other non-current assets.
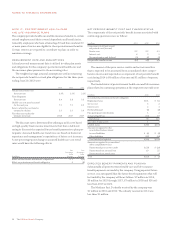
Net sales by product type within each business segment
are as follows:
In millions 2013 2012 2011
SALES
Retail
Meat $2,103 $2,117 $1,984
Meat-centric 685 647 639
Bakery 104 118 135
Commodities/Other 222
Total retail 2,894 2,884 2,760
Foodservice/Other
Meat 507 520 501
Meat-centric 88 86 81
Bakery 343 344 358
Commodities/Other 88 75 61
Total Foodservice/Other 1,026 1,025 1,001
Total business segment sales 3,920 3,909 3,761
Impact of businesses exited/disposed – 55 135
Intersegment elimination – (6) (12)
Total net sales $3,920 $3,958 $3,884