Sara Lee 2013 Annual Report Download - page 17
Download and view the complete annual report
Please find page 17 of the 2013 Sara Lee annual report below. You can navigate through the pages in the report by either clicking on the pages listed below, or by using the keyword search tool below to find specific information within the annual report.-
 1
1 -
2
-
3
-
4
-
5
-
6
-
 7
7 -
 8
8 -
 9
9 -
 10
10 -
 11
11 -
 12
12 -
 13
13 -
 14
14 -
 15
15 -
 16
16 -
 17
17 -
 18
18 -
 19
19 -
 20
20 -
 21
21 -
 22
22 -
 23
23 -
 24
24 -
 25
25 -
 26
26 -
 27
27 -
28
-
29
-
30
-
31
-
32
-
33
-
34
-
35
-
36
-
37
-
38
-
39
-
40
-
41
-
42
-
43
-
44
-
45
-
46
-
47
-
48
-
49
-
50
-
51
-
52
-
53
-
54
-
55
-
56
-
57
-
58
-
59
-
60
-
61
-
62
-
63
-
64
-
65
-
66
-
67
-
68
 |
 |

The Hillshire Brands Company 15
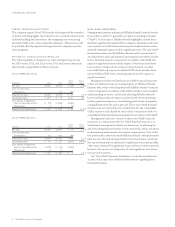
2013 versus 2012 Net sales, which excludes the impact of business
dispositions, increased by $1 million, or 0.1%. The favorable impact
of higher volumes was mostly offset by an unfavorable shift in sales
mix and negative pricing actions in response to lower commodity
costs. Volumes increased 4.5% as higher volumes for processed meat
and commodity meat products were only partially offset by lower
bakery volumes due to the continued weak economic conditions.
Operating segment income, which excludes the impact of
restructuring charges, other significant items and business disposi-
tions, decreased by $4 million, or 5.0%. The decrease was primarily
driven by an unfavorable shift in sales mix and investments in bakery
plant improvements partially offset by increased volumes and lower
commodity costs. Increased investments in MAP were offset by
lower SG&A costs.
2012 versus 2011 Net sales increased by $24 million, or 2.4%. The
impact of price increases in response to higher commodity costs and
an increase in sales of commodity products offset lower foodservice
bakery volumes. The pricing actions increased sales by 3.2%. Overall,
net unit volumes declined 0.1% as lower bakery volumes, due to
demand softness caused by the continued weak economic conditions
and the impact of production disruptions resulting from manufac-
turing plant upgrades at the company’s Tarboro, NC facility, were
only partially offset by higher volumes for meat products.
Operating segment income decreased by $23 million, or 22.4%,
as the unfavorable impact of higher commodity costs, net of pricing
actions, the impact of lower volumes for non-commodity products,
the manufacturing plant disruptions noted above, which reduced
operating segment income by approximately $9 million, higher
trade spending and discounts for aged inventory were only partially
offset by continuous improvement savings and lower SG&A costs.
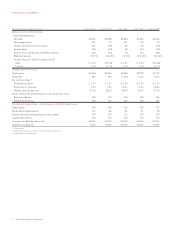
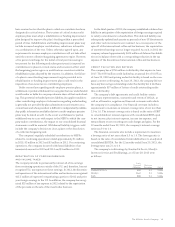
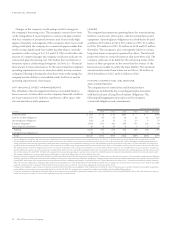
FOODSERVICE/OTHER
Dollar Percent Dollar Percent
In millions 2013 2012 Change Change 2012 2011 Change Change
Net sales $1,026 $1,025 $«1 0.1fi $1,025 $1,001 $«24 2.4fi
Operating segment income $÷÷«75 $÷÷«79 $(4) (5.0)fi $÷÷«79 $÷«102 $(23) (22.4)fi