Sara Lee 2013 Annual Report Download - page 48
Download and view the complete annual report
Please find page 48 of the 2013 Sara Lee annual report below. You can navigate through the pages in the report by either clicking on the pages listed below, or by using the keyword search tool below to find specific information within the annual report.-
 1
1 -
2
-
3
-
4
-
5
-
6
-
7
-
8
-
9
-
10
-
11
-
12
-
13
-
14
-
15
-
16
-
17
-
18
-
19
-
20
-
21
-
22
-
23
-
24
-
25
-
26
-
27
-
28
-
29
-
30
-
31
-
32
-
33
-
34
-
35
-
36
-
37
-
 38
38 -
 39
39 -
 40
40 -
 41
41 -
 42
42 -
 43
43 -
 44
44 -
 45
45 -
 46
46 -
 47
47 -
 48
48 -
 49
49 -
 50
50 -
 51
51 -
 52
52 -
 53
53 -
 54
54 -
 55
55 -
 56
56 -
 57
57 -
 58
58 -
59
-
60
-
61
-
62
-
63
-
64
-
65
-
66
-
67
-
68
 |
 |

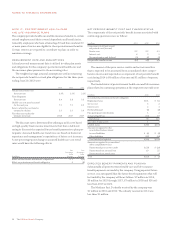
46 The Hillshire Brands Company
NOTES TO FINANCIAL STATEMENTS
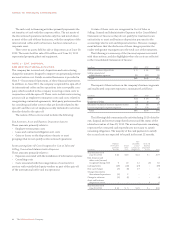
NOTE 9 – STOCK-BASED COMPENSATION
The company has various stock option and stock award plans. At
June 29, 2013, 20.3 million shares were available for future grant
in the form of options, stock unit awards, restricted shares or stock
appreciation rights. The company will satisfy the requirement for
common stock for share-based payments by issuing shares out of
authorized but unissued common stock.
STOCK OPTIONS
The exercise price of each stock option equals the market price of
the company’s stock on the date of grant. Options can generally be
exercised over a maximum term of 10 years. Options generally cliff
vest and expense is recognized on a straight-line basis during the
vesting period.
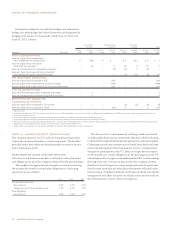
The fair value of each option grant is estimated on the date of
grant using the Black-Scholes option-pricing model and the following
weighted average assumptions:
2013 2012 2011
Weighted average
expected lives 6.0 7.0 7.2
Weighted average
risk-free interest rates 0.95% 1.37% 2.08%
Range of risk-free
interest rates 0.94 – 1.03% 1.28 – 1.38% 1.91 – 2.66%
Weighted average
expected volatility 29.7% 28.1% 28.0%
Range of
expected volatility 29.7 – 30.0% 28.1 – 28.3% 27.3 – 30.0%
Dividend yield 2.0% 2.5% 2.9%
The company uses historical volatility for a period of time that is
comparable to the expected life of the option to determine volatility
assumptions.
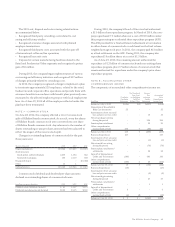
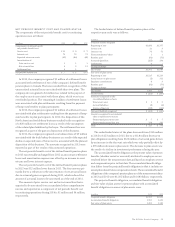
A summary of the changes in stock options outstanding under
the company’s option plans during 2013 is presented below:
Weighted
Weighted Average Aggregate
Average Remaining Intrinsic
Exercise Contractual Value
Shares in thousands Shares Price Term (Years) (in millions)
Options outstanding
at June 30, 2012 6,264 $23.01 3.2 $38
Granted 2,525 25.99 – –
Exercised (2,563) 19.34 – –
Canceled/expired (371) 27.16 – –
Options outstanding
at June 29, 2013 5,855 $25.59 6.3 $44
Options exercisable
at June 29, 2013 3,065 $24.92 3.8 $25
The company received cash from the exercise of stock options
during 2013 of $47 million. As of June 29, 2013, the company had
$10.1 million of total unrecognized compensation expense related
to stock option plans that will be recognized over the weighted
average period of 0.9 years.
In millions except per share data 2013 2012 2011
Number of options exercisable
at end of fiscal year 3,065 5,704 7,784
Weighted average exercise price
of options exercisable
at end of fiscal year $24.92 $22.65 $26.38
Weighted average grant date
fair value of options granted
during the fiscal year $÷6.08 $÷6.35 $÷5.29
Total intrinsic value of options
exercised during the fiscal year $÷22.9 $÷23.5 $÷÷8.0
Fair value of options that vested
during the fiscal year $÷÷0.3 $÷16.9 $÷÷4.5
STOCK UNIT AWARDS
Restricted stock units (RSUs) are granted to certain employees to
incent performance and retention over periods ranging from 1 to 3
years. Upon the achievement of defined parameters, the RSUs are
generally converted into shares of the company’s common stock on
a one-for-one basis and issued to the employees. A portion of all RSUs
vest solely upon continued future service to the company. A portion
of RSUs vest based upon continued future employment and the
achievement of certain defined performance measures. The cost of
these awards is determined using the fair value of the shares on the
date of grant, and compensation is recognized over the period during
which the employees provide the requisite service to the company.
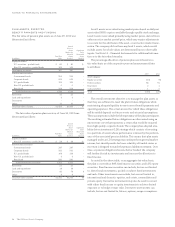
The fair value of performance-based awards pegged to market-
based targets is estimated on the date of grant using a Monte-Carlo
simulation model containing the following assumptions:
2013
Range of risk-free interest rates 0.28 – 0.35%
Range of expected volatility 24.0 – 25.0%
Range of initial TSR (7.3) – 13.1%
Dividend yield 2%
The following is a summary of the changes in the stock unit
awards outstanding under the company’s benefit plans during 2013:
Weighted
Weighted Average Aggregate
Average Remaining Intrinsic
Grant Date Contractual Value
Shares in thousands Shares Fair Value Term (Years) (in millions)
Nonvested share units
at June 30, 2012 340 $26.24 .7 $10
Granted 734 25.02 0 –
Vested (158) 25.66 0 –
Forfeited (71) 26.64 0 –
Nonvested share units
at June 29, 2013 845 $25.26 1.6 $28
Exercisable share units
at June 29, 2013 57 $22.07 5.7 $÷2