Sara Lee 2013 Annual Report Download - page 10
Download and view the complete annual report
Please find page 10 of the 2013 Sara Lee annual report below. You can navigate through the pages in the report by either clicking on the pages listed below, or by using the keyword search tool below to find specific information within the annual report.-
 1
1 -
 2
2 -
 3
3 -
 4
4 -
 5
5 -
 6
6 -
 7
7 -
 8
8 -
 9
9 -
 10
10 -
 11
11 -
 12
12 -
 13
13 -
 14
14 -
 15
15 -
 16
16 -
 17
17 -
 18
18 -
 19
19 -
 20
20 -
 21
21 -
22
-
23
-
24
-
25
-
26
-
27
-
28
-
29
-
30
-
31
-
32
-
33
-
34
-
35
-
36
-
37
-
38
-
39
-
40
-
41
-
42
-
43
-
44
-
45
-
46
-
47
-
48
-
49
-
50
-
51
-
52
-
53
-
54
-
55
-
56
-
57
-
58
-
59
-
60
-
61
-
62
-
63
-
64
-
65
-
66
-
67
-
68
 |
 |

8The Hillshire Brands Company
FINANCIAL REVIEW
FISCAL YEAR 2014 OUTLOOK
The company expects Fiscal 2014 results to be impacted by a number
of factors including higher raw material costs, continued investments
in brand building and innovation, the wrapping of non-recurring
favorable SG&A costs, and competitive dynamics. These factors will
be partially offset by expected savings from the company’s produc-
tivity programs.
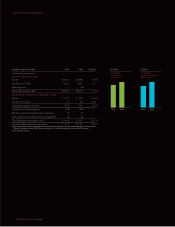
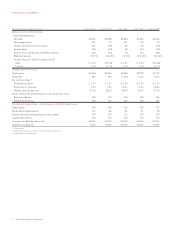
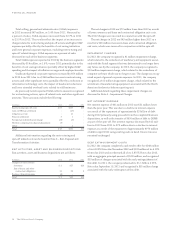
REVIEW OF CONSOLIDATED RESULTS
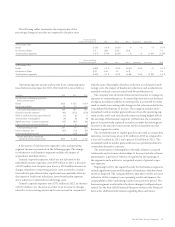
The following tables summarize net sales and operating income
for 2013 versus 2012, and 2012 versus 2011 and certain items that
affected the comparability of these amounts:
2013 VERSUS 2012
Dollar Percent
In millions 2013 2012 Change Change
Net sales $3,920 $3,958 $÷(38) (1.0)fi
Less: net sales from
Dispositions – 55 (55)
Adjusted net sales $3,920 $3,903 $÷«17 0.4fi
Operating income $÷«297 $÷÷«76 $«221 NM
Less: Impact of Significant
items on operating income $÷÷(72) $««(255) $(183)
Dispositions 6 8 (2)
Adjusted operating income $÷«363 $÷«323 $«««40 12.5fi
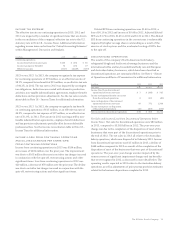
2012 VERSUS 2011
Dollar Percent
In millions 2012 2011 Change Change
Net sales $3,958 $3,884 $÷«74 1.9fi
Less: net sales from
Dispositions 55 135 (80)
Adjusted net sales $3,903 $3,749 $«154 4.1fi
Operating income $÷«÷76 $÷«227 $(151) (66.5)fi
Less: Impact of Significant
items on operating income $÷(255) $«÷«(91) $(164)
Dispositions 835
Adjusted operating income $÷«323 $÷«315 $«««÷8 2.5fi
NON-GAAP MEASURES
Management measures and reports Hillshire Brands’ financial results
in accordance with U.S. generally accepted accounting principles
(“GAAP”). In this report, Hillshire Brands highlights certain items
that have significantly impacted the company’s financial results and
uses several non-GAAP financial measures to help investors under-
stand the financial impact of these significant items. The non-GAAP
financial measures used by Hillshire Brands in this annual report
are adjusted net sales and adjusted operating income which exclude
from a financial measure computed in accordance with GAAP the
impact of significant items and the impact of businesses that have
been exited or disposed of for all periods presented. Another
non-GAAP financial measure is Adjusted EPS which excludes from
reported diluted EPS from continuing operations the impact of
significant items.
Management believes that these non-GAAP financial measures
reflect an additional way of viewing aspects of Hillshire Brands’
business that, when viewed together with Hillshire Brands’ financial
results computed in accordance with GAAP, provide a more complete
understanding of factors and trends affecting Hillshire Brands’
historical financial performance and projected future operating
results, greater transparency of underlying profit trends and greater
comparability of results across periods. These non-GAAP financial
measures are not intended to be a substitute for the comparable
GAAP measures and should be read only in conjunction with our
consolidated financial statements prepared in accordance with GAAP.
Management also uses certain of these non-GAAP financial
measures, in conjunction with the GAAP financial measures, to
understand, manage and evaluate our businesses, in planning for
and forecasting financial results for future periods, and as one factor
in determining achievement of incentive compensation. Two of the
five performance measures under Hillshire Brands’ annual incentive
plan are net sales and earnings before interest and taxes, which are
the reported amounts as adjusted for significant items and possibly
other items. Many of the significant items will recur in future periods;
however, the amount and frequency of each significant item varies
from period to period.
See “Non-GAAP Measures Definitions” in the Financial Review
section of this report for additional information regarding these
financial measures.