Sara Lee 2013 Annual Report Download - page 65
Download and view the complete annual report
Please find page 65 of the 2013 Sara Lee annual report below. You can navigate through the pages in the report by either clicking on the pages listed below, or by using the keyword search tool below to find specific information within the annual report.-
 1
1 -
2
-
3
-
4
-
5
-
6
-
7
-
8
-
9
-
10
-
11
-
12
-
13
-
14
-
15
-
16
-
17
-
18
-
19
-
20
-
21
-
22
-
23
-
24
-
25
-
26
-
27
-
28
-
29
-
30
-
31
-
32
-
33
-
34
-
35
-
36
-
37
-
38
-
39
-
40
-
41
-
42
-
43
-
44
-
45
-
46
-
47
-
48
-
49
-
50
-
51
-
52
-
53
-
54
-
 55
55 -
 56
56 -
 57
57 -
 58
58 -
 59
59 -
 60
60 -
 61
61 -
 62
62 -
 63
63 -
 64
64 -
 65
65 -
 66
66 -
 67
67 -
 68
68
 |
 |
The Hillshire Brands Company 63
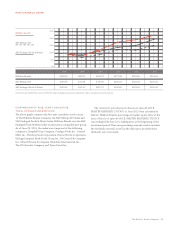
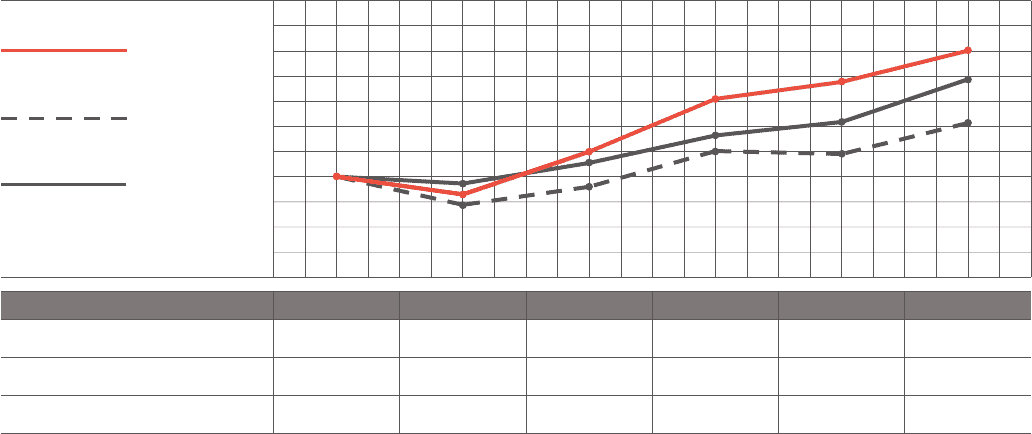
PERFORMANCE GRAPH
The returns for periods prior to Sara Lee’s spin-off of D.E.
MASTER BLENDERS 1753 N.V. in June 2012 were calculated as
follows: Hillshire Brands’ percentage of market equity value at the
time of Sara Lee’s spin-off of D.E. MASTER BLENDERS 1753 N.V.
was multiplied by Sara Lee’s trading price at the beginning of the
investment period. That same percentage was also used to calculate
the dividends received, as well as the share price at which those
dividends were reinvested.
COMPARISON OF FIVE-YEAR CUMULATIVE
TOTAL STOCKHOLDER RETURN
The above graph compares the five-year cumulative total returns
of The Hillshire Brands Company, the S&P Midcap 400 Index and
S&P Packaged Foods & Meats Index. Hillshire Brands uses the S&P
Packaged Foods & Meats Index to represent a comparable peer group.
As of June 29, 2013, the index was comprised of the following
companies: Campbell Soup Company, ConAgra Foods Inc., General
Mills, Inc., Hershey Foods Corporation, Hormel Foods Corporation,
Kellogg Company, Kraft Foods Group Inc., McCormick & Company
Inc., Mead Johnson & Company, Mondelez International Inc.,
The JM Smucker Company, and Tyson Foods Inc.
$0
$50
$100
$150
$200
$250
Hillshire Brands$100.00 $124.72$177.08$193.86$224.93
S&P Midcap 400
$100.00 $÷89.92 $125.33 $122.41 $153.24
S&P Packaged Foods & Meats
$100.00 $113.57 $140.82$154.18 $196.54
$82.35
$71.98
$93.13
S&P Midcap 400
Hillshire Brands
S&P Packaged Foods & Meats
2008 2009 2010 2011 2012 2013
$100 invested on 06/28/08 in stock or 6/30/08 in index, including reinvestment of dividends. Indexes calculated on month-end basis.