Sara Lee 2013 Annual Report Download - page 56
Download and view the complete annual report
Please find page 56 of the 2013 Sara Lee annual report below. You can navigate through the pages in the report by either clicking on the pages listed below, or by using the keyword search tool below to find specific information within the annual report.-
 1
1 -
2
-
3
-
4
-
5
-
6
-
7
-
8
-
9
-
10
-
11
-
12
-
13
-
14
-
15
-
16
-
17
-
18
-
19
-
20
-
21
-
22
-
23
-
24
-
25
-
26
-
27
-
28
-
29
-
30
-
31
-
32
-
33
-
34
-
35
-
36
-
37
-
38
-
39
-
40
-
41
-
42
-
43
-
44
-
45
-
 46
46 -
 47
47 -
 48
48 -
 49
49 -
 50
50 -
 51
51 -
 52
52 -
 53
53 -
 54
54 -
 55
55 -
 56
56 -
 57
57 -
 58
58 -
 59
59 -
 60
60 -
 61
61 -
 62
62 -
 63
63 -
 64
64 -
 65
65 -
 66
66 -
67
-
68
 |
 |

54 The Hillshire Brands Company
NOTES TO FINANCIAL STATEMENTS
PLAN ASSETS, EXPECTED
BENEFIT PAYMENTS AND FUNDING
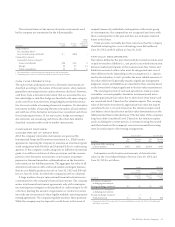
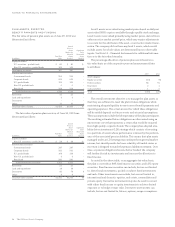
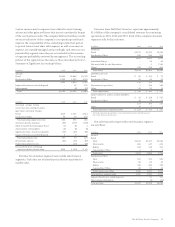
The fair value of pension plan assets as of June 29, 2013 was
determined as follows:
Quoted
Prices in
Active Significant
Market for Other
Identical Observable
Total Fair Assets Inputs
In millions Value (Level 1) (Level 2)
Equity securities
U.S. securities – pooled funds $÷«÷85 $÷«÷85 $–
Non-U.S. securities – pooled funds 102 102 –
Total equity securities 187 187 –
Fixed income securities
Government bonds 256 256 –
Corporate bonds 503 503 –
U.S. pooled funds 122 122 –
Non-U.S. pooled funds 55–
Bond fund 324 324 –
Total fixed income securities 1,210 1,210 –
Real estate 23 23 –
Cash and equivalents 66–
Derivatives –––
Other 13 13 –
Total fair value of assets $1,439 $1,439 $–
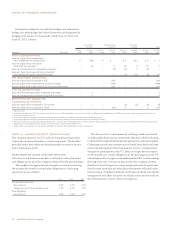
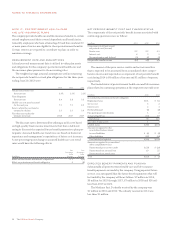
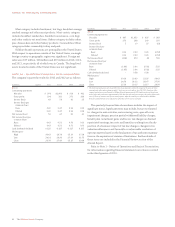
The fair value of pension plan assets as of June 30, 2012 was
determined as follows:
Quoted
Prices in
Active Significant
Market for Other
Identical Observable
Total Fair Assets Inputs
In millions Value (Level 1) (Level 2)
Equity securities
Non-U.S. securities – pooled funds $÷«÷38 $÷«÷38 $–
Fixed income securities
Government bonds 247 247 –
Corporate bonds 593 593 –
U.S. pooled funds 168 168 –
Non-U.S. pooled funds 66–
Bond fund 341 341 –
Total fixed income securities 1,355 1,355 –
Real estate 21 21 –
Cash and equivalents 14 14 –
Derivatives 83 74 9
Other 44–
Total fair value of assets $1,515 $1,506 $9
Level 1 assets were valued using market prices based on daily net
asset value (NAV) or prices available through a public stock exchange.
Level 2 assets were valued primarily using market prices, derived from
either an active market quoted price, which may require adjustments
to account for the attributes of the asset, or an inactive market trans-
action. The company did not have any level 3 assets, which would
include assets for which values are determined by non-observable
inputs. See Note 15 – Financial Instruments for additional informa-
tion as to the fair value hierarchy.
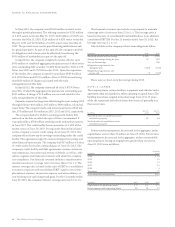
The percentage allocation of pension plan assets based on a
fair value basis as of the respective year-end measurement dates
is as follows:
2013 2012
Asset category
Equity securities 13% 6%
Debt securities 84 91
Real estate 21
Cash and other 12
Total 100% 100%
The overall investment objective is to manage the plan assets so
that they are sufficient to meet the plan’s future obligations while
maintaining adequate liquidity to meet current benefit payments and
operating expenses. The actual amount for which these obligations
will be settled depends on future events and actuarial assumptions.
These assumptions include the life expectancy of the plan participants.
The resulting estimated future obligations are discounted using an
interest rate curve that represents a return that would be required
from high quality corporate bonds. The company has adopted a lia-
bility driven investment (LDI) strategy which consists of investing
in a portfolio of assets whose performance is driven by the perform-
ance of the associated pension liability. This means that plan assets
managed under an LDI strategy may underperform general market
returns, but should provide for lower volatility of funded status as
its return is designed to match the pension liability movement. Over
time, as pension obligations become better funded, the company
will further de-risk its investments and increase the allocation to
fixed income.
As noted in the above table, on an aggregate fair value basis,
the plan is currently at 84% fixed income securities and 13% equity
securities. Fixed income securities can include, but are not limited
to, direct bond investments, pooled or indirect bond investments
and cash. Other investments can include, but are not limited to,
international and domestic equities, real estate, commodities and
private equity. Derivative instruments may also be used in concert
with either fixed income or equity investments to achieve desired
exposure or to hedge certain risks. Derivative instruments can
include, but are not limited to, futures, options, swaps or swaptions.