Sara Lee 2013 Annual Report Download - page 15
Download and view the complete annual report
Please find page 15 of the 2013 Sara Lee annual report below. You can navigate through the pages in the report by either clicking on the pages listed below, or by using the keyword search tool below to find specific information within the annual report.-
 1
1 -
2
-
3
-
4
-
 5
5 -
 6
6 -
 7
7 -
 8
8 -
 9
9 -
 10
10 -
 11
11 -
 12
12 -
 13
13 -
 14
14 -
 15
15 -
 16
16 -
 17
17 -
 18
18 -
 19
19 -
 20
20 -
 21
21 -
 22
22 -
 23
23 -
 24
24 -
 25
25 -
26
-
27
-
28
-
29
-
30
-
31
-
32
-
33
-
34
-
35
-
36
-
37
-
38
-
39
-
40
-
41
-
42
-
43
-
44
-
45
-
46
-
47
-
48
-
49
-
50
-
51
-
52
-
53
-
54
-
55
-
56
-
57
-
58
-
59
-
60
-
61
-
62
-
63
-
64
-
65
-
66
-
67
-
68
 |
 |

The Hillshire Brands Company 13
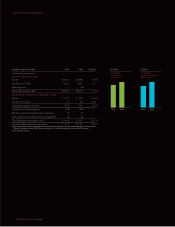
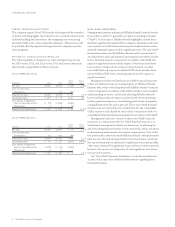
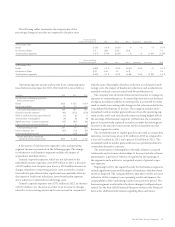
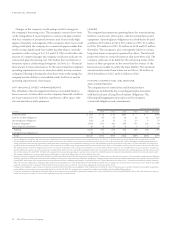
The following tables summarize the components of the
percentage change in net sales as compared to the prior year:
Volume (Excluding
Acquisition/Disposition) Mix Price Other Acquisition Disposition Total
2013 versus 2012
Retail (0.1)fi 0.6fi (0.2)fi –fi –% –fi 0.3fi
Foodservice/Other 4.5 (3.6) (0.4) (0.4) – – 0.1
Total business segments 1.4fi (0.7)fi (0.3)fi –fi –% (1.4)fi (1.0)fi
Volume (Excluding
Acquisition/Disposition) Mix Price Other Acquisition Disposition Total
2012 versus 2011
Retail (3.8)fi 0.5fi 4.6% (0.6)fi 3.8% –fi 4.5fi
Foodservice/Other (0.1) (0.5) 3.2 (0.2) – – 2.4
Total business segments (2.6)fi 0.1fi 4.2% (0.4)fi 2.8% (2.2)fi 1.9fi
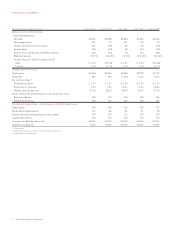
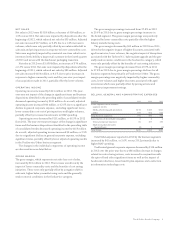
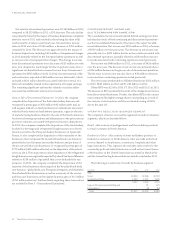
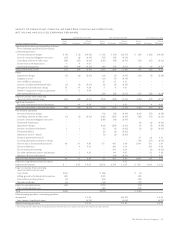
Operating segment income and income from continuing opera-
tions before income taxes for 2013, 2012 and 2011 are as follows:
In millions 2013 2012 2011
Income from continuing operations
before income taxes
Retail $329 $«313 $«314
Foodservice/Other 75 79 102
Total operating segment income 404 392 416
General corporate expenses (93) (272) (159)
Mark-to-market derivative gains/(losses) (1) (1) 2
Amortization of intangibles (4) (4) (4)
Significant items – business segments (15) (47) (31)
Impact of businesses exited/disposed 683
Total operating income 297 76 227
Interest expense, net (41) (72) (87)
Debt extinguishment costs – (39) (55)
Income (loss) from continuing
operations before income taxes $256 $÷(35) $÷«85
A discussion of each business segment’s sales and operating
segment income is presented on the following pages. The change
in volumes for each business segment excludes the impact of
acquisitions and dispositions.
General corporate expenses, which are not allocated to the
individual business segments, were $93 million in 2013, a decrease
of $179 million over the prior year due to a $151 million decrease in
charges related to restructuring actions, costs incurred in conjunc-
tion with the spin-off and other significant items partially offset by
the impact of headcount reductions, lower benefit plan expenses
and a reduction in information technology costs.
General corporate expenses were $272 million in 2012, an increase
of $113 million over the prior year due to an increase in charges
related to restructuring actions and costs incurred in conjunction
with the spin-off partially offset by a reduction in information tech-
nology costs, the impact of headcount reductions and a reduction in
stranded overhead costs associated with divested businesses.
The company uses derivative financial instruments to manage its
exposure to commodity prices. A commodity derivative not declared
a hedge in accordance with the accounting rules is accounted for under
mark-to-market accounting with changes in fair value recorded in the
Consolidated Statements of Income. The company excludes these
unrealized mark-to-market gains and losses from the operating seg-
ment results until such time that the exposure being hedged affects
the earnings of the business segment. At that time, the cumulative
gain or loss previously reported as mark-to-market derivative gains/
(losses) for the derivative instrument will be reclassified into the
business segment’s results.
The unrealized mark-to-market gain/loss incurred on commodity
derivative contracts was a loss of $1 million in 2013 as compared to
a loss of $1 million in 2012 and a gain of $2 million in 2011. The
unrealized mark-to-market gains and losses are primarily related to
commodity derivative contracts.
The amortization of intangibles in the table relates to acquired
trademarks and customer relationships. It does not include software
amortization, a portion of which is recognized in the earnings of
the segments and a portion is recognized as part of general corpo-
rate expenses.
Beginning in 2013, the reported results for the business segments
exclude significant items and the impact of businesses that have been
exited or disposed. The company believes that these results are more
indicative of the company’s core operating results and improve the
comparability of the underlying results from period to period. The
business segment results reflect the above changes for all periods pre-
sented. See the Non-GAAP Financial Measures section in the Financial
Review for additional information regarding these exclusions.