Samsung 2008 Annual Report Download - page 99
Download and view the complete annual report
Please find page 99 of the 2008 Samsung annual report below. You can navigate through the pages in the report by either clicking on the pages listed below, or by using the keyword search tool below to find specific information within the annual report.-
 1
1 -
2
-
3
-
4
-
5
-
6
-
7
-
8
-
9
-
10
-
11
-
12
-
13
-
14
-
15
-
16
-
17
-
18
-
19
-
20
-
21
-
22
-
23
-
24
-
25
-
26
-
27
-
28
-
29
-
30
-
31
-
32
-
33
-
34
-
35
-
36
-
37
-
38
-
39
-
40
-
41
-
42
-
43
-
44
-
45
-
46
-
47
-
48
-
49
-
50
-
51
-
52
-
53
-
54
-
55
-
56
-
57
-
58
-
59
-
60
-
61
-
62
-
63
-
64
-
65
-
66
-
67
-
68
-
69
-
70
-
71
-
72
-
73
-
74
-
75
-
76
-
77
-
78
-
79
-
80
-
81
-
82
-
83
-
84
-
85
-
86
-
87
-
88
-
 89
89 -
 90
90 -
 91
91 -
 92
92 -
 93
93 -
 94
94 -
 95
95 -
 96
96 -
 97
97 -
 98
98 -
 99
99 -
 100
100 -
 101
101 -
 102
102 -
 103
103 -
 104
104 -
 105
105 -
 106
106
 |
 |

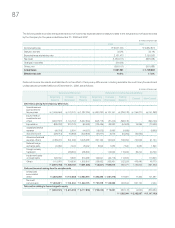
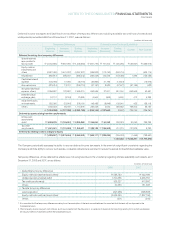
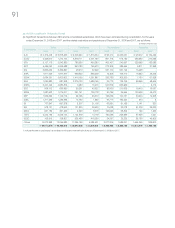
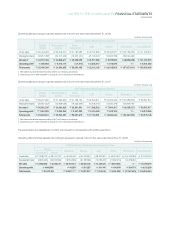
Operating data of entities classified according to geographic area as of and for the year ended December 31, 2007:
(In millions of Korean won)
The presentation and classification of 2007 was revised for comparability with 2008 presentation.
2007 Summary of Business by Geographic Area
Korea
Domestic Export Americas Europe Asia China Elimination Consolidated
Gross sales ₩
18,962,111 ₩
57,414,865 ₩
31,657,811 ₩
41,703,043 ₩
23,668,887 ₩
35,184,906 ₩
(110,083,806) ₩
98,507,817
Intersegment sales
(4,788,207) (50,449,491) (12,089,350) (14,751,677) (7,928,861) (20,076,220) 110,083,806 -
Net sales ₩
14,173,904 ₩
6,965,374 ₩
19,568,461 ₩
26,951,366 ₩
15,740,026 ₩
15,108,686
₩
- ₩
98,507,817
Operating profit ₩
6,819,490 ₩
206,549 ₩
641,551 ₩
329,685 ₩
723,686 ₩
252,325 ₩
8,973,286
Total assets ₩
84,014,706 ₩
10,458,239 ₩
10,877,916 ₩
5,593,774 ₩
7,798,092 ₩
(25,367,591) ₩
93,375,136
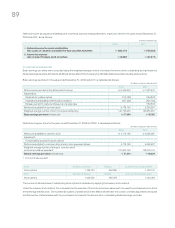
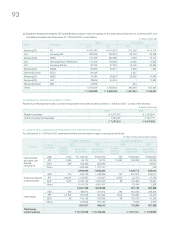
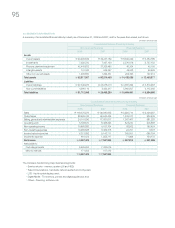
33. TRANSACTION NOT AFFECTING CASH FLOWS
Significant transactions not affecting cash flows for the years ended December 31, 2008 and 2007, are as follows:
34. SUBSEQUENT EVENT
Subsequent to December 31, 2008, Samsung Card, one of SEC domestic subsidiary issued unguaranteed bonds amounting to ₩310,000
million(bond issue number 1811 through 1820) as of the date of this report.
(In millions of Korean won)
Write-off of accounts receivables and others
₩
502,243
₩
483,841
Increase (decrease) in gain on valuation of available-for-sale securities 656,703 956,298
Increase in loss on valuation of available-for-sale securities 28,656 1,139
Decrease in gain on valuation of available-for-sale securities due to disposal 3,983 14,650
Decrease in loss on valuation of available-for-sale- securities due to disposal 143 1,387
Increase in share of equity-method investees’ accumulated other comprehensive income 7,111 109,633
Decrease in share of equity-method investees’ accumulated other comprehensive loss 6,309 35,870
Current maturities of long-term prepaid expenses 217,812 168,268
Current maturities of long-term debts 71,465 72,520
Reclassification of construction-in-progress and
machinery-in-transit to other property, plant and equipment accounts 10,297,439 11,834,995
Current maturities of other long-term liabilities 303,914 304,374
Current maturities of long-term advances received 168,650 171,383
Current maturities of long-term accrued expenses 270,702 433,943
2008 2007