Samsung 2008 Annual Report Download - page 98
Download and view the complete annual report
Please find page 98 of the 2008 Samsung annual report below. You can navigate through the pages in the report by either clicking on the pages listed below, or by using the keyword search tool below to find specific information within the annual report.-
 1
1 -
2
-
3
-
4
-
5
-
6
-
7
-
8
-
9
-
10
-
11
-
12
-
13
-
14
-
15
-
16
-
17
-
18
-
19
-
20
-
21
-
22
-
23
-
24
-
25
-
26
-
27
-
28
-
29
-
30
-
31
-
32
-
33
-
34
-
35
-
36
-
37
-
38
-
39
-
40
-
41
-
42
-
43
-
44
-
45
-
46
-
47
-
48
-
49
-
50
-
51
-
52
-
53
-
54
-
55
-
56
-
57
-
58
-
59
-
60
-
61
-
62
-
63
-
64
-
65
-
66
-
67
-
68
-
69
-
70
-
71
-
72
-
73
-
74
-
75
-
76
-
77
-
78
-
79
-
80
-
81
-
82
-
83
-
84
-
85
-
86
-
87
-
 88
88 -
 89
89 -
 90
90 -
 91
91 -
 92
92 -
 93
93 -
 94
94 -
 95
95 -
 96
96 -
 97
97 -
 98
98 -
 99
99 -
 100
100 -
 101
101 -
 102
102 -
 103
103 -
 104
104 -
 105
105 -
 106
106
 |
 |
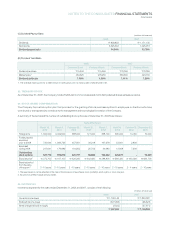
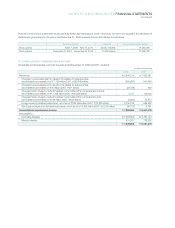
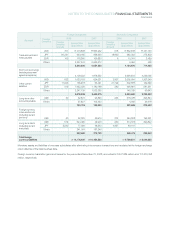
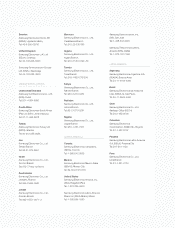
(In millions of Korean won)
1. Net sales include intersegment sales of SEC and foreign subsidiaries.
2. Operating profit of each segment is inclusive of all consolidation eliminations.
Gross sales
₩
90,443,226
₩
64,676,221
₩
41,760,580
₩
42,707,995
₩
26,465,381
₩
(144,759,084)
₩
121,294,319
Intersegment sales
(48,251,458) (30,107,544) (19,407,221) (21,190,427) (16,965,796) 135,922,446 -
Net sales 1
₩
42,191,768
₩
34,568,677
₩
22,353,359
₩
21,517,568
₩
9,499,585
₩
(8,836,638)
₩
121,294,319
Operating profit 2
₩
396,183
₩
2,976,174
₩
(1,970)
₩
2,346,047
₩
315,429
₩
-
₩
6,031,863
Total assets
₩
32,469,248
₩
24,536,835
₩
38,054,435
₩
22,112,165
₩
26,035,808
₩
(37,907,841)
₩
105,300,650
2008 Summary of Business by Segment
Digital Telecommuni- Semi-
Media cations Conductor LCD Others Elimination Consolidated
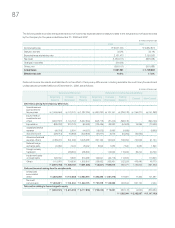
NOTES TO THE CONSOLIDATED FINANCIAL STATEMENTS
CONTINUED
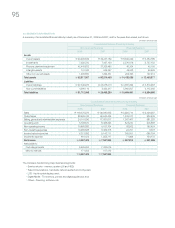
(In millions of Korean won)
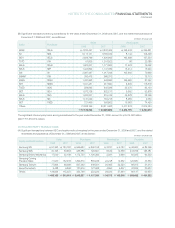
Operating data according to business segment as of and for the year ended December 31, 2007:
1. Net sales include intersegment sales of SEC and foreign subsidiaries.
2. Operating profit of each segment is inclusive of all consolidation eliminations.
Gross sales
₩
66,207,662
₩
47,293,364
₩
41,765,150
₩
32,500,801
₩
20,824,646
₩
(110,083,806)
₩
98,507,817
Intersegment sales
(35,687,457) (20,599,036) (19,433,649) (15,438,278) (12,840,379) 103,998,799 -
Net sales 1
₩
30,520,205
₩
26,694,328
₩
22,331,501
₩
17,062,523
₩
7,984,267
₩
(6,085,007)
₩
98,507,817
Operating profit 2
₩
1,094,989
₩
2,892,246
₩
2,347,239
₩
2,115,629
₩
523,183
₩
-
₩
8,973,286
Total assets
₩
23,605,531
₩
25,954,291
₩
35,051,679
₩
17,750,581
₩
16,380,645
₩
(25,367,591)
₩
93,375,136
2007 Summary of Business by Segment
Digital Telecommuni- Semi-
Media cations Conductor LCD Others Elimination Consolidated
The presentation and classification of 2007 was revised for comparability with 2008 presentation.
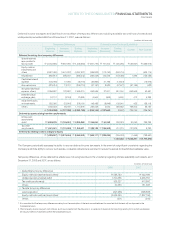
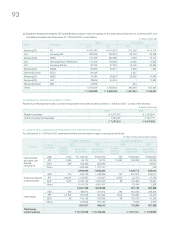
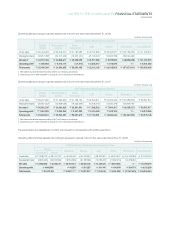
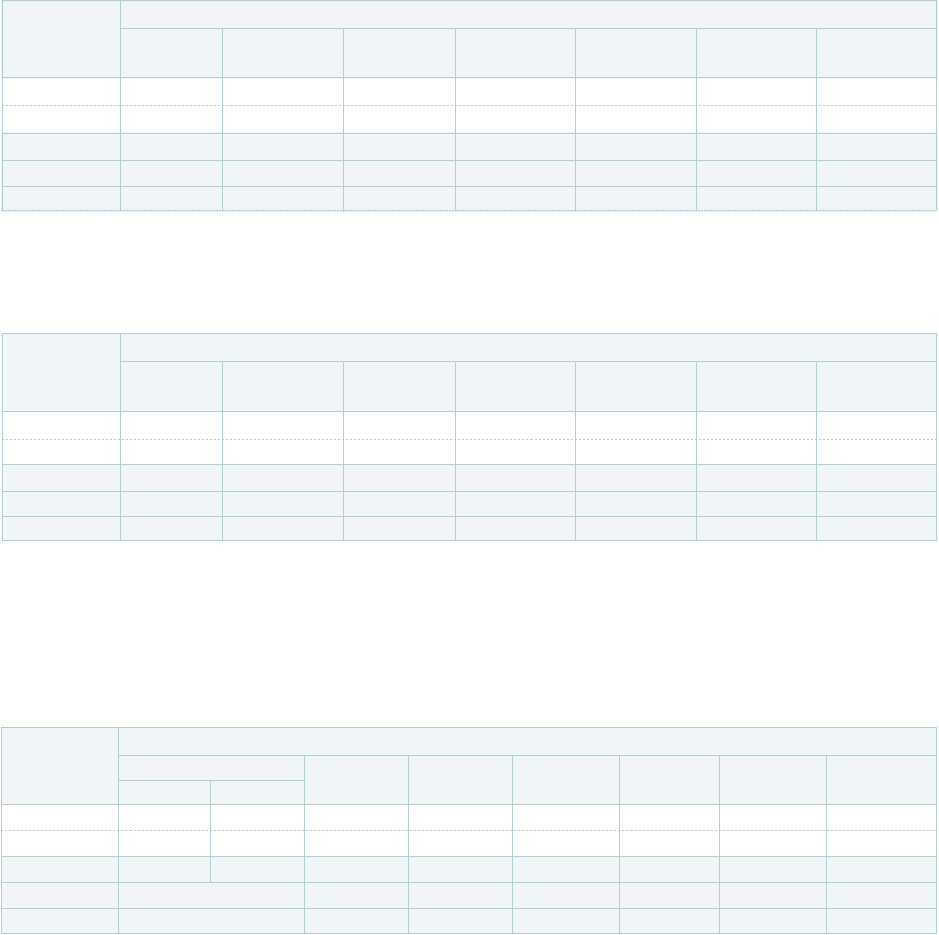
Operating data of entities classified according to geographic area as of and for the year ended December 31, 2008:
(In millions of Korean won)
2008 Summary of Business by Geographic Area
Korea
Domestic Export Americas Europe Asia China Elimination Consolidated
Gross sales ₩
21,398,073 ₩
69,074,728 ₩
45,246,448 ₩
54,416,816 ₩
29,242,661 ₩
46,674,677 ₩
(144,759,084) ₩
121,294,319
Intersegment sales
(5,935,230) (60,976,594) (19,804,936) (20,186,680) (10,053,631) (27,802,013) 144,759,084 -
Net sales ₩
15,462,843 ₩
8,098,134 ₩
25,441,512 ₩
34,230,136 ₩
19,189,030 ₩
18,872,664
₩
- ₩
121,294,319
Operating profit ₩ 4,648,865 ₩
90,559 ₩
261,827 ₩
301,440 ₩
404,699 ₩
324,473 ₩
6,031,863
Total assets ₩
94,013,961
₩
18,887,777 ₩
13,927,357 ₩
7,218,168 ₩
9,161,228 ₩
(37,907,841) ₩
105,300,650
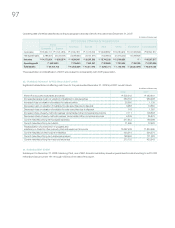
Operating data according to business segment as of and for the year ended December 31, 2008: