Samsung 2008 Annual Report Download - page 78
Download and view the complete annual report
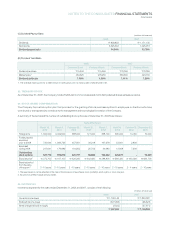
Please find page 78 of the 2008 Samsung annual report below. You can navigate through the pages in the report by either clicking on the pages listed below, or by using the keyword search tool below to find specific information within the annual report.-
 1
1 -
2
-
3
-
4
-
5
-
6
-
7
-
8
-
9
-
10
-
11
-
12
-
13
-
14
-
15
-
16
-
17
-
18
-
19
-
20
-
21
-
22
-
23
-
24
-
25
-
26
-
27
-
28
-
29
-
30
-
31
-
32
-
33
-
34
-
35
-
36
-
37
-
38
-
39
-
40
-
41
-
42
-
43
-
44
-
45
-
46
-
47
-
48
-
49
-
50
-
51
-
52
-
53
-
54
-
55
-
56
-
57
-
58
-
59
-
60
-
61
-
62
-
63
-
64
-
65
-
66
-
67
-
 68
68 -
 69
69 -
 70
70 -
 71
71 -
 72
72 -
 73
73 -
 74
74 -
 75
75 -
 76
76 -
 77
77 -
 78
78 -
 79
79 -
 80
80 -
 81
81 -
 82
82 -
 83
83 -
 84
84 -
 85
85 -
 86
86 -
 87
87 -
 88
88 -
89
-
90
-
91
-
92
-
93
-
94
-
95
-
96
-
97
-
98
-
99
-
100
-
101
-
102
-
103
-
104
-
105
-
106
 |
 |
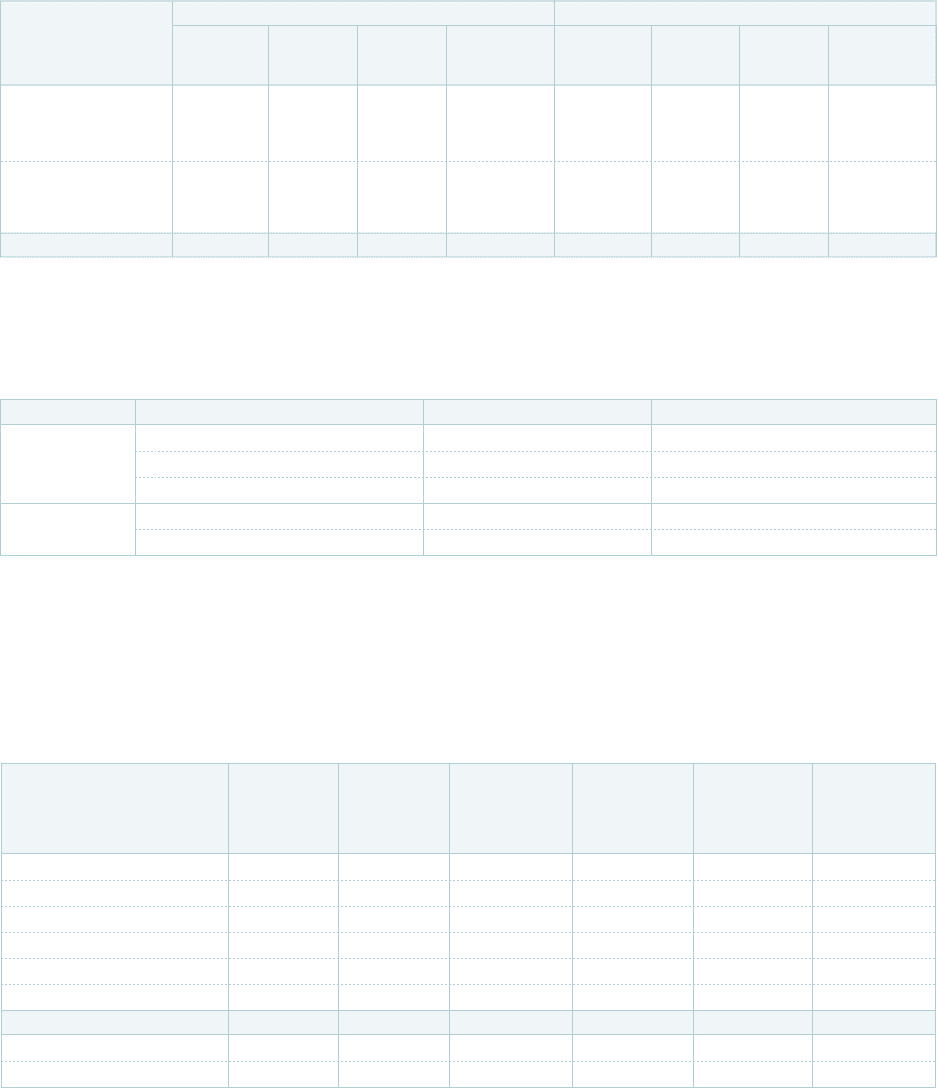
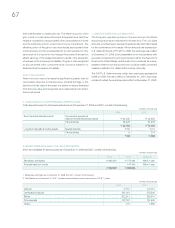
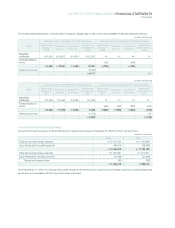
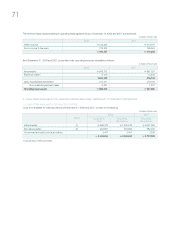
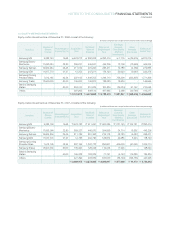
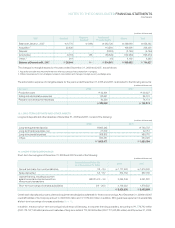
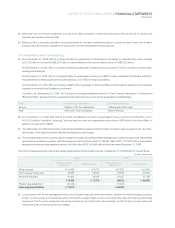
Share of equity-method investees’ other comprehensive income or loss as of December 31, 2008 and 2007, are as follows:
As of December 31, 2008, share of equity-method investees’ other comprehensive income and loss included the tax effect of ₩48,250
million and ₩1,188 million, respectively.
(In millions of Korean won)
Balance at Balance at Balance at Balance at
January 1, Valuation Included in December 31, January 1, Valuation Included in December 31,
2008 Amount Earnings 2008 2007 Amount Earnings 2007
2008 2007
Share of equity- method
investees’ other
comprehensive income
₩
251,591
₩
5,737
₩
-
₩
257,328
₩
141,958
₩
109,633
₩
-
₩
251,591
Share of equity-method
investees’ other
comprehensive loss (8,017) (6,003) (579) (13,441) (43,887) 33,479 (2,391) (8,017)
₩
243,574
₩
(266)
₩
(579)
₩
243,887
₩
98,071
₩
143,112
₩
(2,391)
₩
243,574
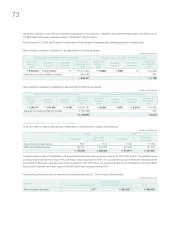
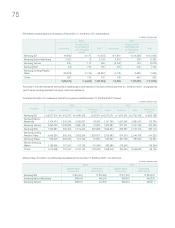
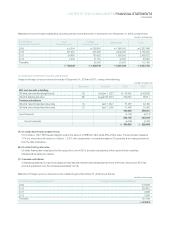
The Company has not applied the equity method of accounting for following investees:
1. Investments are excluded from the application of equity method of accounting because the Company does not have the ability to exercise significant influence over
the operating and financial policies, in accordance with the Monopoly Regulations and Fair Trade Law No. 11.
2. These investments are excluded from the application of equity method of accounting either because their total assets at the prior fiscal year end were less than
₩
7,000 million, or are in the process of liquidation.
Korea Samsung Everland ¹ 25.64 Absence of significant influence
Allat ¹ 30.00 Absence of significant influence
International Cyber Marketing ² 45.00 Limited assets
Asia Samsung Electronic Ticaret A.S. ² 20.00 Limited assets under liquidation
Future Technology & Service ² 28.60 Limited assets
Location Subsidiaries Percentage of Ownership (%) Reason
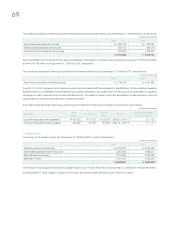
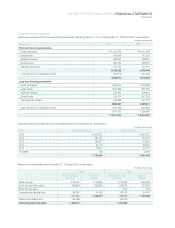
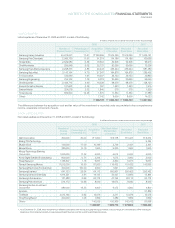
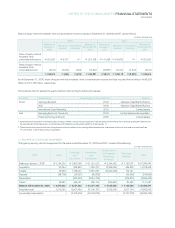
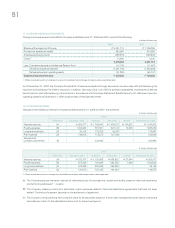
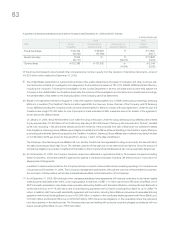
11. PROPERTY, PLANT AND EQUIPMENT
Changes in property, plant and equipment for the years ended December 31, 2008 and 2007, consist of the following:
(In millions of Korean won)
Construction-
Buildings Machinery In-Progress/ Tools and
Land and and Machinery- Vehicles Total
Structures Equipment In-Transit
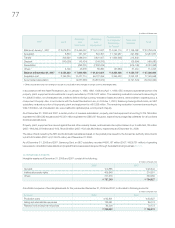
Balance at January 1, 2008
₩
3,154,330
₩
7,800,158
₩
21,921,021
₩
3,354,428
₩
1,150,707
₩
37,380,644
Acquisition 22,094 265,853 1,062,701 12,269,006 455,975 14,075,629
Transfer 45,986 1,168,031 8,910,681 (10,297,439) 172,741 -
Disposal (58,705) (26,327) (95,609) - (65,249) (245,890)
Depreciation - (632,243) (8,616,476) - (606,810) (9,855,529)
Others 1 48,387 456,421 845,144 (290,957) 82,462 1,141,457
Balance at December 31, 2008
₩
3,212,092
₩
9,031,893
₩
24,027,462
₩
5,035,038
₩
1,189,826
₩
42,496,311
Acquisition cost 3,212,092 12,507,469 67,190,337 5,035,038 3,917,104 91,862,040
Accumulated depreciation - (3,475,576) (43,162,875) - (2,727,278) (49,365,729)
2008
NOTES TO THE CONSOLIDATED FINANCIAL STATEMENTS
CONTINUED