Samsung 2008 Annual Report Download - page 92
Download and view the complete annual report
Please find page 92 of the 2008 Samsung annual report below. You can navigate through the pages in the report by either clicking on the pages listed below, or by using the keyword search tool below to find specific information within the annual report.-
 1
1 -
2
-
3
-
4
-
5
-
6
-
7
-
8
-
9
-
10
-
11
-
12
-
13
-
14
-
15
-
16
-
17
-
18
-
19
-
20
-
21
-
22
-
23
-
24
-
25
-
26
-
27
-
28
-
29
-
30
-
31
-
32
-
33
-
34
-
35
-
36
-
37
-
38
-
39
-
40
-
41
-
42
-
43
-
44
-
45
-
46
-
47
-
48
-
49
-
50
-
51
-
52
-
53
-
54
-
55
-
56
-
57
-
58
-
59
-
60
-
61
-
62
-
63
-
64
-
65
-
66
-
67
-
68
-
69
-
70
-
71
-
72
-
73
-
74
-
75
-
76
-
77
-
78
-
79
-
80
-
81
-
 82
82 -
 83
83 -
 84
84 -
 85
85 -
 86
86 -
 87
87 -
 88
88 -
 89
89 -
 90
90 -
 91
91 -
 92
92 -
 93
93 -
 94
94 -
 95
95 -
 96
96 -
 97
97 -
 98
98 -
 99
99 -
 100
100 -
 101
101 -
 102
102 -
103
-
104
-
105
-
106
 |
 |

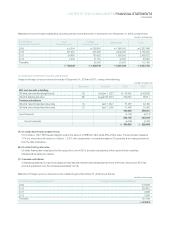
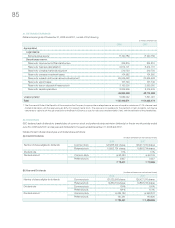
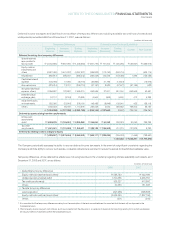
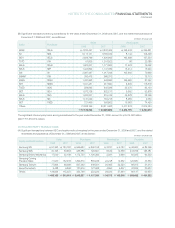
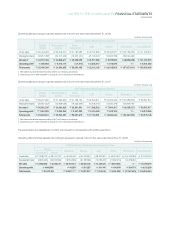
Potential common stock shares that could potentially dilute basic earnings per share in the future, but were not included in the calculation of
diluted earnings per share for the year ended December 31, 2008, because they are anti-dilutive, are as follows:
(In millions of Korean won)
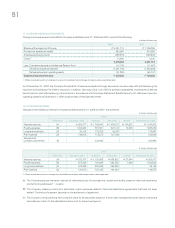
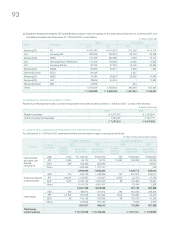
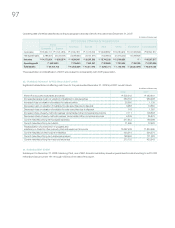
27. CONSOLIDATED COMPREHENSIVE INCOME
Consolidated comprehensive income for the years ended December 31, 2008 and 2007, consist of:
Stock options April 17, 2006 ~ April 16, 2014 524,871 shares
₩
580,300
Stock options December 21, 2007 ~ December 20, 2015 10,000 shares
₩
606,700
Exercise Period Quantity Exercise Price (Per share)
Net income
₩
5,890,214
₩
7,922,981
Changes in accumulated gain on valuation of available-for-sale securities,
net of related income taxes of
₩
371,759 million (2007:
₩
338,645 million) (660,687) 941,648
Changes in accumulated loss on valuation of available-for-sale securities,
net of related income taxes of
₩
30 million (2007:
₩
211 million) (28,799) 248
Changes in share of equity-method investees’ accumulated other comprehensive income,
net of related income taxes of
₩
12,349 million (2007:
₩
60,599 million) 5,737 109,633
Changes in share of equity-method investees’ accumulated other comprehensive loss,
net of related income taxes of
₩
729 million (2007:
₩
459 million) (5,424) 35,870
Foreign currency translation adjustment, net of tax of
₩
324,059 million (2007:
₩
13,828 million) 2,735,128 525,538
Gain (loss) on valuation of derivative instruments, net of tax of
₩
13,802 million (2007:
₩
2,202 million) (46,313) 5,761
Consolidated comprehensive income
₩
7,889,856
₩
9,541,679
Attributable to:
Controlling interests
₩
7,458,595
₩
8,763,144
Minority interests 431,261 778,535
₩
7,889,856
₩
9,541,679
2008 2007
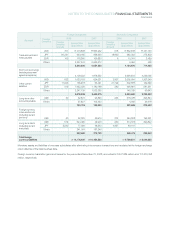
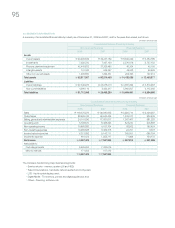
NOTES TO THE CONSOLIDATED FINANCIAL STATEMENTS
CONTINUED