Samsung 2008 Annual Report Download - page 94
Download and view the complete annual report
Please find page 94 of the 2008 Samsung annual report below. You can navigate through the pages in the report by either clicking on the pages listed below, or by using the keyword search tool below to find specific information within the annual report.-
 1
1 -
2
-
3
-
4
-
5
-
6
-
7
-
8
-
9
-
10
-
11
-
12
-
13
-
14
-
15
-
16
-
17
-
18
-
19
-
20
-
21
-
22
-
23
-
24
-
25
-
26
-
27
-
28
-
29
-
30
-
31
-
32
-
33
-
34
-
35
-
36
-
37
-
38
-
39
-
40
-
41
-
42
-
43
-
44
-
45
-
46
-
47
-
48
-
49
-
50
-
51
-
52
-
53
-
54
-
55
-
56
-
57
-
58
-
59
-
60
-
61
-
62
-
63
-
64
-
65
-
66
-
67
-
68
-
69
-
70
-
71
-
72
-
73
-
74
-
75
-
76
-
77
-
78
-
79
-
80
-
81
-
82
-
83
-
 84
84 -
 85
85 -
 86
86 -
 87
87 -
 88
88 -
 89
89 -
 90
90 -
 91
91 -
 92
92 -
 93
93 -
 94
94 -
 95
95 -
 96
96 -
 97
97 -
 98
98 -
 99
99 -
 100
100 -
 101
101 -
 102
102 -
 103
103 -
 104
104 -
105
-
106
 |
 |
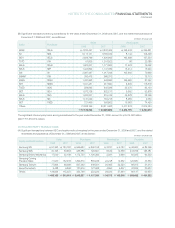
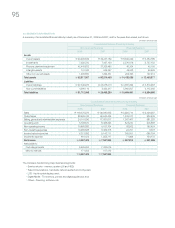
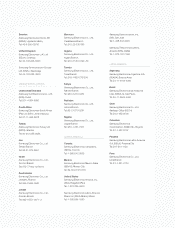
(In millions of Korean won)
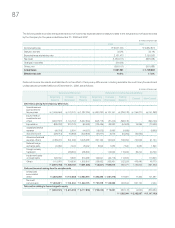
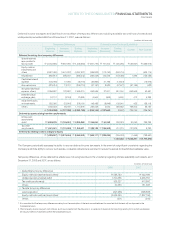
Significant transactions among subsidiaries for the years ended December 31, 2008 and 2007, and the related receivables as of
December 31, 2008 and 2007, are as follows:
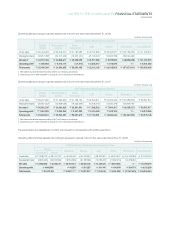
(B)
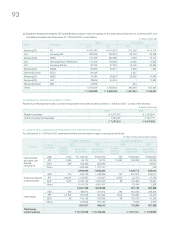
The significant intercompany loans among subsidiaries for the year ended December 31, 2008, amount to ₩3,414,022 million
(2007: ₩1,516,374 million).
SESK SELS
₩
4,832,457
₩
3,832,499
₩
396,408
₩
295,821
SII SEA 5,117,141 3,180,049 8,142 106,428
SEH SELS 2,656,769 1,800,663 162,888 157,534
TSTC STA 57,826 1,216,822 66 22,088
SELS SEUK 1,602,037 1,171,582 11,523 16,292
SELS SEF 1,427,862 1,147,339 13,414 13,920
SSI SII 2,087,497 1,017,949 105,602 70,869
SSKMT STA 383,475 988,373 - 75,713
SSEG SESK 1,437,963 943,860 159,960 81,362
SET SESK 1,041,481 917,890 5,536 113,318
TSED SCIC 556,563 845,589 55,270 63,120
SET SEH 1,073,728 822,217 9,902 92,878
SELS SEG 1,203,847 815,416 46,878 32,299
SELS SEI 1,131,029 784,213 8,986 9,760
SET TSED 721,469 693,862 16,983 74,450
Others 31,808,159 23,811,663 3,417,233 2,814,220
₩
57,139,303
₩
43,989,986
₩
4,418,791
₩
4,040,072
Sales Receivables
Seller Purchaser 2008 2007 2008 2007
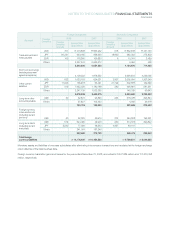
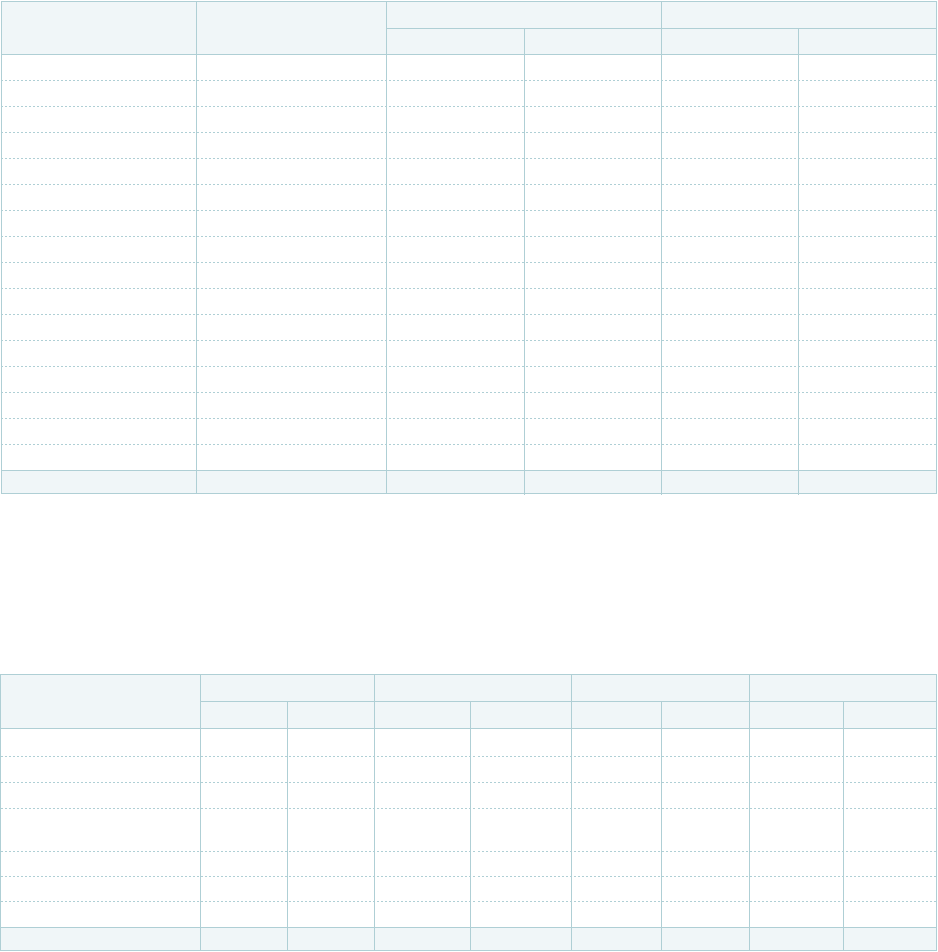
(In millions of Korean won)
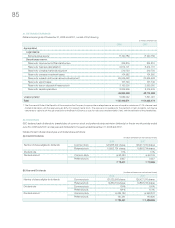
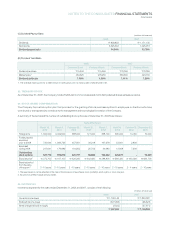
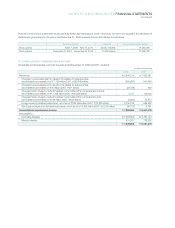
(A)
Samsung SDI
₩
91,363
₩
120,793
₩
569,683
₩
860,198
₩
2,831
₩
9,783
₩
48,093
₩
86,296
Samsung SDS 60,166 33,563 933,386 726,661 8,549 12,368 243,765 158,481
Samsung Electro-Mechanics 17,540 32,109 1,172,753 1,126,395 2,281 2,664 62,025 64,529
Samsung Corning
Precision Glass 71,940 132,233 1,369,370 865,935 22,248 12,562 126,680 47,330
Samsung Techwin 77,804 66,099 507,263 448,501 24,985 22,520 88,973 31,413
Seoul Commtech 9,488 9,868 137,616 127,668 4,550 5,807 42,809 32,633
Others 126,854 115,354 353,786 252,222 29,534 37,844 86,137 43,650
₩
455,155
₩
510,019
₩
5,043,857
₩
4,407,580
₩
94,978
₩
103,548
₩
698,482
₩
464,332
2008 2007 2008 2007 2008 2007 2008 2007
Equity-method Investees Sales Purchases Receivables Payables
Significant transactions between SEC and equity-method investees for the years ended December 31, 2008 and 2007, and the related
receivables and payables as of December 31, 2008 and 2007, are as follows:
29. RELATED PARTY TRANSACTIONS
NOTES TO THE CONSOLIDATED FINANCIAL STATEMENTS
CONTINUED