Samsung 2008 Annual Report Download - page 58
Download and view the complete annual report
Please find page 58 of the 2008 Samsung annual report below. You can navigate through the pages in the report by either clicking on the pages listed below, or by using the keyword search tool below to find specific information within the annual report.
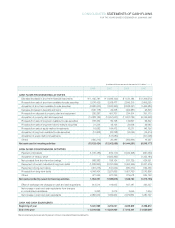
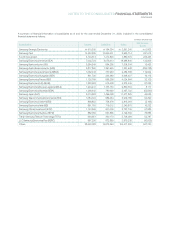
The accompanying notes are an integral part of these consolidated financial statements.
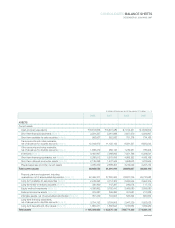
CONSOLIDATED STATEMENTS OF CASH FLOWS
FOR THE YEARS ENDED DECEMBER 31, 2008 AND 2007
(In millions of Korean won and in thousands of U.S. dollars (Note 3))
2008 2007 2008 2007
CASH FLOWS FROM INVESTING ACTIVITIES
Decrease (Increase) in short-term financial instruments
₩
1,445,781
₩
(1,646,130) $ 1,150,184 $ (1,309,570)
Proceeds from sale of short-term available-for-sale securities 3,576,436 3,028,477 2,845,216 2,409,290
Acquisition of short-term available-for-sale securities (3,580,000) (1,842,360) (2,848,051) (1,465,680)
Decrease (Increase) in deposits and loans (506,178) 29,348 (402,687) 23,348
Proceeds from disposal of property, plant and equipment 295,287 491,701 234,914 391,170
Acquisition of property, plant and equipment (14,088,184) (12,251,537) (11,207,784) (9,746,648)
Proceeds from sale of long-term available-for-sale securities 188,332 82,198 149,827 65,392
Proceeds from sale of long-term held-to-maturity securities 31,234 49,124 24,848 39,080
Proceeds from sale of equity-method investments 16,682 184,472 13,271 146,756
Acquisition of long-term available-for-sale securities (12,602) (20,758) (10,025) (16,514)
Acquisition of equity-method investments - (127,080) - (101,098)
Others (495,212) 20,486 (393,964) 16,297
Net cash used in investing activities (13,128,424) (12,002,059) (10,444,251) (9,548,177)
CASH FLOWS FROM FINANCING ACTIVITIES
Payment of dividends (1,315,486) (819,110) (1,046,528) (651,639)
Acquisition of treasury stock - (1,825,395) - (1,452,184)
Net proceeds from short-term borrowings 668,383 798,134 531,729 634,951
Repayment of current maturities of long-term debts (1,826,860) (2,767,259) (1,453,349) (2,201,479)
Repayment of long-term debts (415,275) (191,644) (330,370) (152,461)
Proceeds from long-term debts 4,346,404 2,527,696 3,457,760 2,010,896
Others 477,055 677,766 379,518 539,193
Net cash provided by (used in) financing activities 1,934,221 (1,599,812) 1,538,760 (1,272,723)
Effect of exchange rate changes on cash and cash equivalents 813,514 419,005 647,187 333,337
Net increase in cash and cash equivalents from changes
in consolidated subsidiaries 3,263 2,016 2,596 1,604
Net increase in cash and cash equivalents 2,982,649 1,609,962 2,372,832 1,280,797
CASH AND CASH EQUIVALENTS
Beginning of year 5,831,989 4,222,027 4,639,609 3,358,812
End of the year
₩
8,814,638
₩
5,831,989 $ 7,012,441 $ 4,639,609


