Samsung 2008 Annual Report Download - page 95
Download and view the complete annual report
Please find page 95 of the 2008 Samsung annual report below. You can navigate through the pages in the report by either clicking on the pages listed below, or by using the keyword search tool below to find specific information within the annual report.-
 1
1 -
2
-
3
-
4
-
5
-
6
-
7
-
8
-
9
-
10
-
11
-
12
-
13
-
14
-
15
-
16
-
17
-
18
-
19
-
20
-
21
-
22
-
23
-
24
-
25
-
26
-
27
-
28
-
29
-
30
-
31
-
32
-
33
-
34
-
35
-
36
-
37
-
38
-
39
-
40
-
41
-
42
-
43
-
44
-
45
-
46
-
47
-
48
-
49
-
50
-
51
-
52
-
53
-
54
-
55
-
56
-
57
-
58
-
59
-
60
-
61
-
62
-
63
-
64
-
65
-
66
-
67
-
68
-
69
-
70
-
71
-
72
-
73
-
74
-
75
-
76
-
77
-
78
-
79
-
80
-
81
-
82
-
83
-
84
-
 85
85 -
 86
86 -
 87
87 -
 88
88 -
 89
89 -
 90
90 -
 91
91 -
 92
92 -
 93
93 -
 94
94 -
 95
95 -
 96
96 -
 97
97 -
 98
98 -
 99
99 -
 100
100 -
 101
101 -
 102
102 -
 103
103 -
 104
104 -
 105
105 -
106
 |
 |
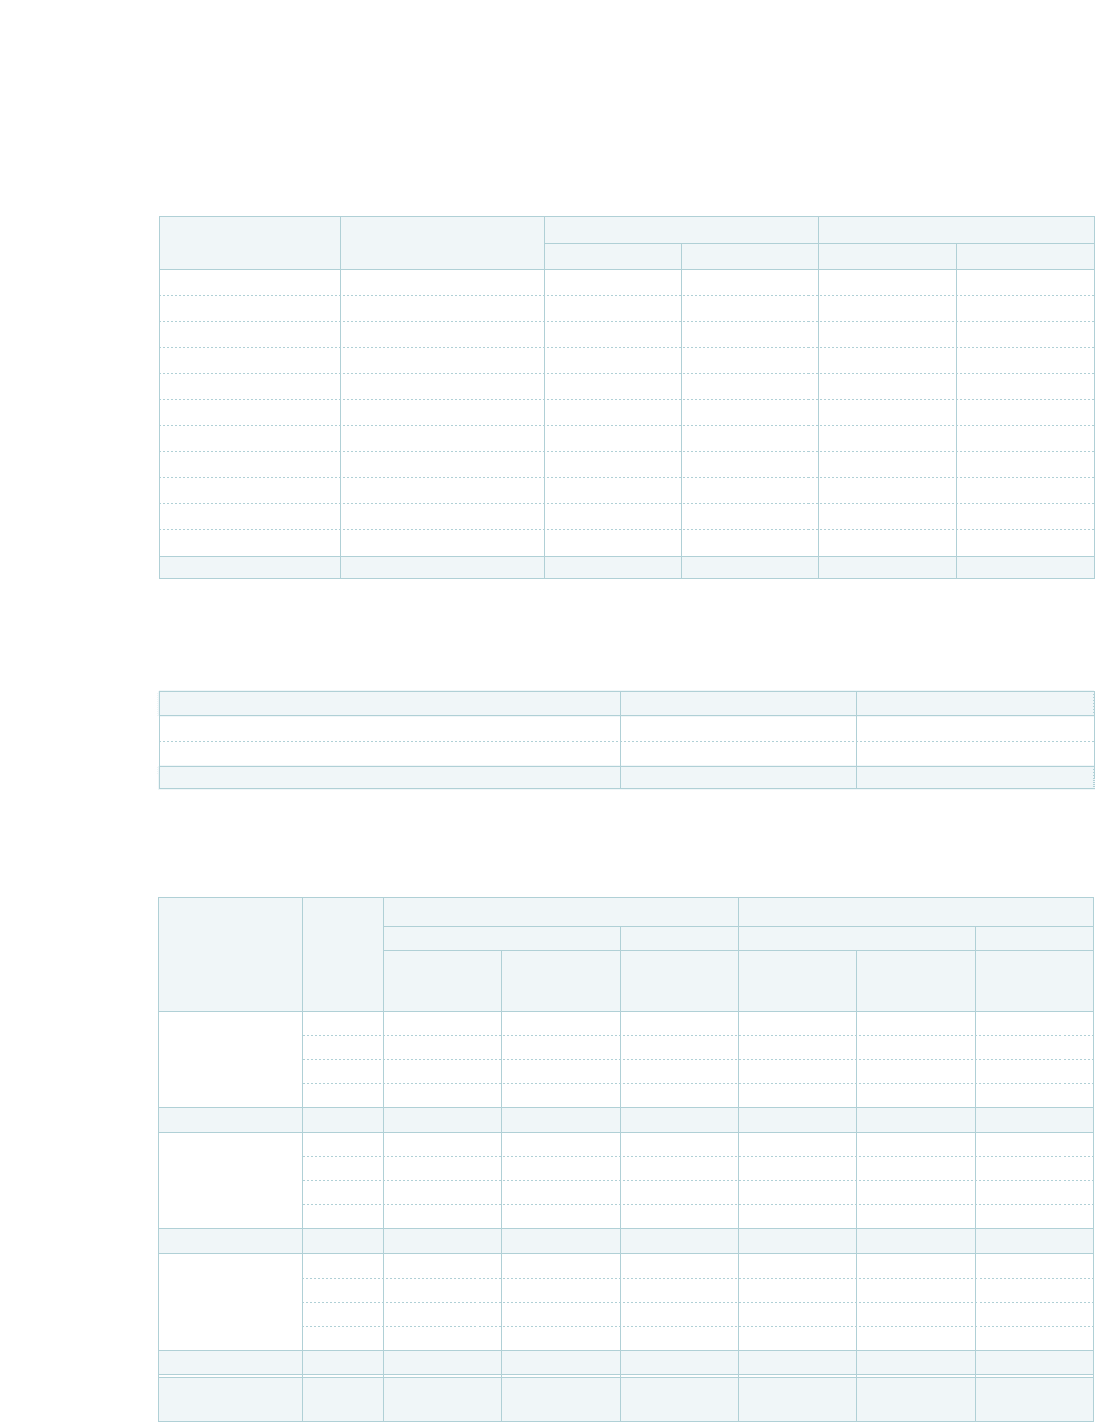
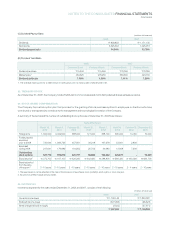
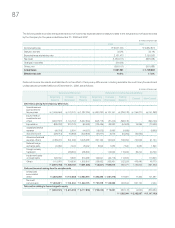
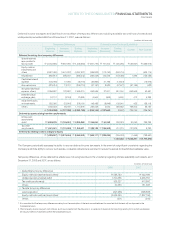
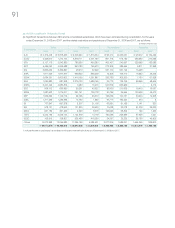
Significant transactions between SEC subsidiaries and equity-method investees for the years ended December 31, 2008 and 2007, and
the related receivables as of December 31, 2008 and 2007, are as follows:
(B)
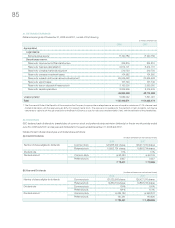
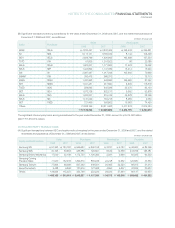
30. RESEARCH AND DEVELOPMENT COSTS
Research and development costs incurred and expensed for the years ended December 31, 2008 and 2007, consist of the following:
(In millions of Korean won)
Research expenses
₩
2,677,815
₩
2,353,844
Ordinary development expenses 4,380,095 3,720,115
₩
7,057,910
₩
6,073,959
2008 2007
(In millions of Korean won)
Samsung SDI SII
₩
300,780
₩
415,381
₩
3,209
₩
14,174
SJC Samsung SDI 230,836 236,834 52,276 20,248
Samsung SDI SESK 212,763 292,685 3,398 16,142
SJC Samsung Electro-Mechanics 141,404 109,669 13,282 11,925
SJC Samsung Techwin 87,224 87,960 15,409 25,980
Samsung SDI SDMA 82,969 53,971 4,928 1,434
Samsung Techwin SELS 81,024 - 2,507 -
Samsung SDI SESC 79,484 28,824 28,255 10,480
Samsung SDI SJC 78,506 54,019 - 11,852
Samsung Techwin SEA 64,845 - 544 -
Others 3,195,064 2,728,863 383,856 302,826
₩
4,554,899
₩
4,008,206
₩
507,664
₩
415,061
Sales Receivables
Seller Purchaser 2008 2007 2008 2007
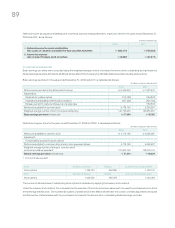
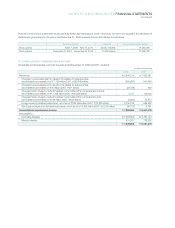
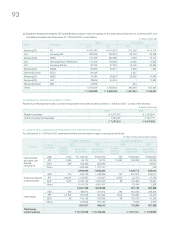
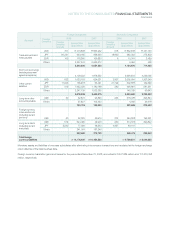
31. ASSETS AND LIABILITIES DENOMINATED IN FOREIGN CURRENCIES
As of December 31, 2008 and 2007, assets and liabilities denominated in foreign currencies are as follows:
(In millions of Korean won and foreign currencies)
Foreign Companies Domestic Companies
Foreign 2008 2007 2008 2007
Currency Foreign Foreign
Currency Korean Won Korean Won Currency Korean Won Korean Won
Amount (Equivalent) (Equivalent) Amount (Equivalent) (Equivalent)
USD 1,072
₩
1,348,191
₩
827,532 708
₩
890,384
₩
684,564
JPY 3,954 55,110 13,012 10,000 139,389 93,225
EUR 356 632,326 623,082 - - 56,967
Others 1,929,356 1,372,737 - 338
3,964,983 2,836,363 1,029,773 835,094
USD 732 920,706 1,368,286 197 247,613 503,871
JPY 93,541 1,303,857 973,027 2,567 35,778 27,148
EUR 1,933 3,433,126 2,332,303 83 147,685 30,961
Others 5,149,734 4,951,467 20,644 2,558
10,807,423 9,625,083 451,720 564,538
USD 389 488,873 261,912 384 482,825 298,564
JPY 27,402 381,956 251,022 7,604 105,990 20,870
EUR 92 164,146 150,645 68 120,970 41,253
Others 916,842 331,463 6,069 6,676
1,951,817 995,042 715,854 367,363
Total foreign
currency assets
₩
16,724,223
₩
13,456,488
₩
2,197,347
₩
1,766,995
Account
Cash and cash
equivalent, and
financial
instruments
Trade accounts and
notes receivable
Other assets