Samsung 2008 Annual Report Download - page 55
Download and view the complete annual report
Please find page 55 of the 2008 Samsung annual report below. You can navigate through the pages in the report by either clicking on the pages listed below, or by using the keyword search tool below to find specific information within the annual report.-
 1
1 -
2
-
3
-
4
-
5
-
6
-
7
-
8
-
9
-
10
-
11
-
12
-
13
-
14
-
15
-
16
-
17
-
18
-
19
-
20
-
21
-
22
-
23
-
24
-
25
-
26
-
27
-
28
-
29
-
30
-
31
-
32
-
33
-
34
-
35
-
36
-
37
-
38
-
39
-
40
-
41
-
42
-
43
-
44
-
 45
45 -
 46
46 -
 47
47 -
 48
48 -
 49
49 -
 50
50 -
 51
51 -
 52
52 -
 53
53 -
 54
54 -
 55
55 -
 56
56 -
 57
57 -
 58
58 -
 59
59 -
 60
60 -
 61
61 -
 62
62 -
 63
63 -
 64
64 -
 65
65 -
66
-
67
-
68
-
69
-
70
-
71
-
72
-
73
-
74
-
75
-
76
-
77
-
78
-
79
-
80
-
81
-
82
-
83
-
84
-
85
-
86
-
87
-
88
-
89
-
90
-
91
-
92
-
93
-
94
-
95
-
96
-
97
-
98
-
99
-
100
-
101
-
102
-
103
-
104
-
105
-
106
 |
 |

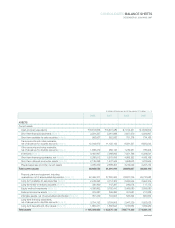
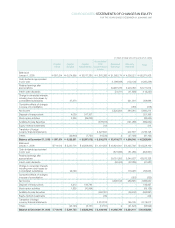
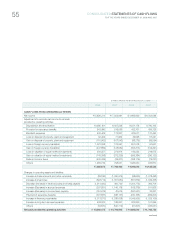
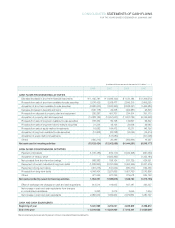
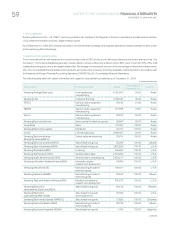
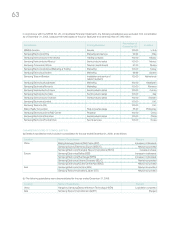
CONSOLIDATED STATEMENTS OF CHANGES IN EQUITY
FOR THE YEARS ENDED DECEMBER 31, 2008 AND 2007
continued
(In millions of Korean won, in thousands of U.S. dollars)
Capital
Stock
Capital
Surplus
Capital
Adjustments
Retained
Earnings
Minority
Interests Total
Accumulated
Other
Comprehensive
Income
Balance at
January 1, 2007
₩
897,514
₩
6,364,604
₩
(6,994,210)
₩
532,820
₩
44,463,683
₩
2,675,456
₩
47,939,867
Cash dividends appropriated
in prior year - - - - (746,075) (5,888) (751,963)
Retained earnings after
appropriations - - - - 43,717,608 2,669,568 47,187,904
Interim cash dividends - - - - (73,036) (21,793) (94,829)
Change in ownership interests,
including new stock issues by
consolidated subsidiaries - 185,395 - - - 879,367 1,064,762
Disposal of equity-method
investments - 90,365 - - - 55,465 145,830
Cumulative effects of changes
in scope of consolidation - 17,970 - - - - 17,970
Net income - - - - 7,420,579 502,402 7,922,981
Acquisition of treasury stock - - (1,825,395) - - - (1,825,395)
Disposal of treasury stock - (5,978) 187,925 - - - 181,947
Stock option activities - 2,403 (63,955) - - - (61,552)
Available-for-sale Securities - - - 698,339 - 190,711 889,050
Equity-method investments - - - 145,503 - - 145,503
Translation of foreign
currency financial statements - - - 496,509 - 29,029 525,538
Others - (79,764) (51,746) 2,214 23 1,472 (127,801)
Balance at December 31, 2007
₩
897,514
₩
6,574,995
₩
(8,747,381)
₩
1,875,385
₩
51,065,174
₩
4,306,221
₩
55,971,908
Balance at
January 1, 2007
$ 714,012 $ 5,063,329 $ (5,564,208)
$ 423,882
$ 35,372,858 $ 2,128,445 $ 38,138,318
Cash dividends appropriated
in prior year - - - - (593,536) (4,684) (598,220)
Retained earnings after
appropriations - - - - 34,779,322 2,123,761 37,540,098
Interim cash dividends - - - - (58,103) (17,337) (75,440)
Change in ownership interests,
including new stock issues by
consolidated subsidiaries - 147,490 - - - 699,576 847,066
Disposal of equity-method
investments - 71,889 - - - 44,125 116,014
Cumulative effects of changes
in scope of consolidation - 14,296 - - - - 14,296
Net income - - - - 5,903,404 399,684 6,303,088
Acquisition of treasury stock - - (1,452,184) - - - (1,452,184)
Disposal of treasury stock - (4,757) 149,503 - - - 144,746
Stock option activities - 1,912 (50,879) - - - (48,967)
Available-for-sale Securities - - - 555,560 - 151,719 707,279
Equity-method investments - - - 115,754 - - 115,754
Translation of foreign
currency financial statements - - - 394,995 - 23,094 418,089
Others - (63,455) (41,165) 1,762 18 1,170 (101,670)
Balance at December 31, 2007 $ 714,012 $ 5,230,704 $ (6,958,933) $ 1,491,953 $ 40,624,641 $ 3,425,792 $ 44,528,169