Samsung 2008 Annual Report Download - page 57
Download and view the complete annual report
Please find page 57 of the 2008 Samsung annual report below. You can navigate through the pages in the report by either clicking on the pages listed below, or by using the keyword search tool below to find specific information within the annual report.-
 1
1 -
2
-
3
-
4
-
5
-
6
-
7
-
8
-
9
-
10
-
11
-
12
-
13
-
14
-
15
-
16
-
17
-
18
-
19
-
20
-
21
-
22
-
23
-
24
-
25
-
26
-
27
-
28
-
29
-
30
-
31
-
32
-
33
-
34
-
35
-
36
-
37
-
38
-
39
-
40
-
41
-
42
-
43
-
44
-
45
-
46
-
 47
47 -
 48
48 -
 49
49 -
 50
50 -
 51
51 -
 52
52 -
 53
53 -
 54
54 -
 55
55 -
 56
56 -
 57
57 -
 58
58 -
 59
59 -
 60
60 -
 61
61 -
 62
62 -
 63
63 -
 64
64 -
 65
65 -
 66
66 -
 67
67 -
68
-
69
-
70
-
71
-
72
-
73
-
74
-
75
-
76
-
77
-
78
-
79
-
80
-
81
-
82
-
83
-
84
-
85
-
86
-
87
-
88
-
89
-
90
-
91
-
92
-
93
-
94
-
95
-
96
-
97
-
98
-
99
-
100
-
101
-
102
-
103
-
104
-
105
-
106
 |
 |
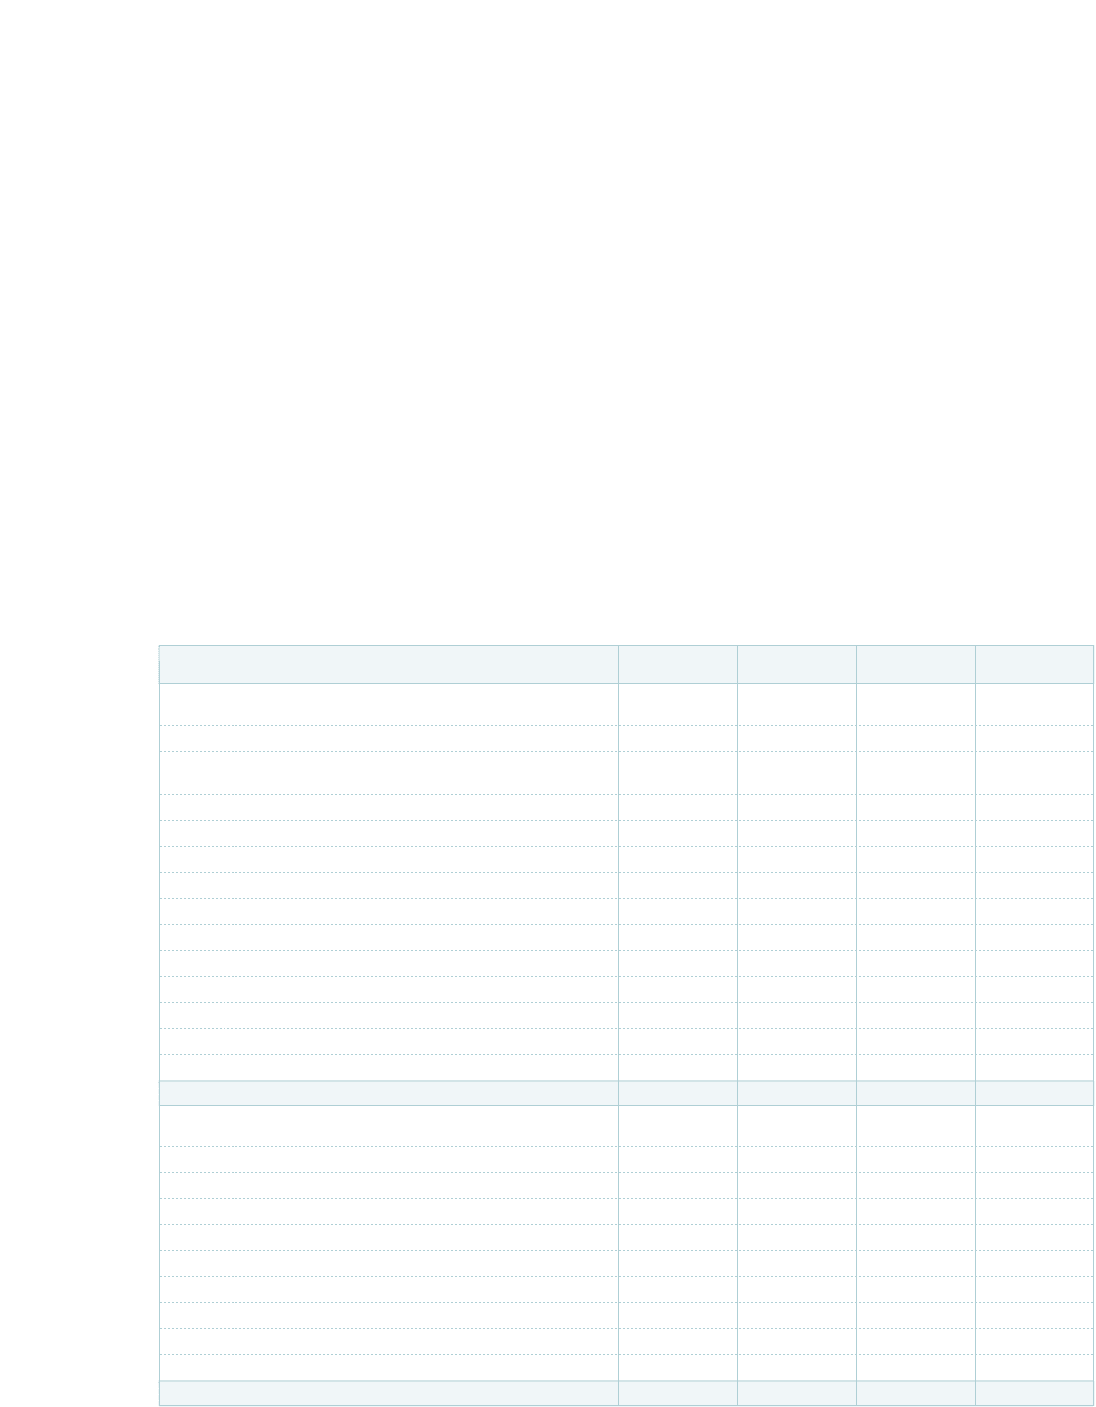
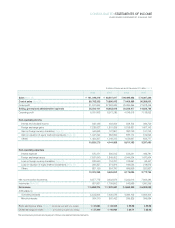
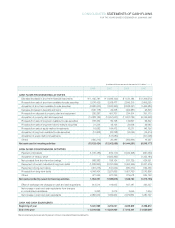
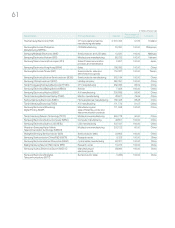
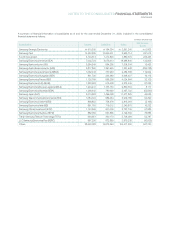
CONSOLIDATED STATEMENTS OF CASH FLOWS
FOR THE YEARS ENDED DECEMBER 31, 2008 AND 2007
2008 2007 2008 2007
CASH FLOWS FROM OPERATING ACTIVITIES
Net income
₩
5,890,214
₩
7,922,981 $ 4,685,930 $ 6,303,088
Adjustments to reconcile net income to net cash
provided by operating activities
Depreciation and amortization 10,095,191 8,497,528 8,031,178 6,760,165
Provision for severance benefits 543,980 615,586 432,761 489,726
Bad debt expenses 532,429 172,827 423,571 137,492
Loss on disposal of property, plant and equipment 62,292 71,964 49,556 57,251
Gain on disposal of property, plant and equipment (110,962) (107,542) (88,275) (85,554)
Loss on foreign currency translation 1,070,358 122,597 851,518 97,531
Gain on foreign currency translation (447,885) (128,580) (356,313) (102,291)
Loss on valuation of equity-method investments 209,357 274,874 166,553 218,675
Gain on valuation of equity-method investments (748,398) (372,239) (595,384) (296,133)
Deferred income taxes (500,435) (99,601) (398,119) (79,237)
Others 1,289,732 798,031 1,026,040 634,870
17,885,873 17,768,426 14,229,016 14,135,583
Changes in operating assets and liabilities
Increase in trade accounts and notes receivable (86,180) (1,355,615) (68,560) (1,078,453)
Increase in inventories (693,712) (1,301,580) (551,879) (1,035,465)
Decrease (Increase) in trade accounts and notes payable (1,514,400) 464,720 (1,204,773) 369,706
Increase (Decrease) in accrued expenses (207,881) 1,146,178 (165,379) 911,836
Increase (Decrease) in income taxes payable (751,619) 43,576 (597,947) 34,667
Payment of severance benefits (301,887) (338,137) (240,165) (269,003)
Increase in financing receivables (1,313,573) (1,288,638) (1,045,006) (1,025,169)
Increase in long-term accrued expenses 408,324 198,601 324,840 157,995
Others (64,870) (546,719) (51,607) (434,941)
Net cash provided by operating activities
₩
13,360,075
₩
14,790,812 $ 10,628,540 $ 11,766,756
(In millions of Korean won and in thousands of U.S. dollars (Note 3))
continued