Samsung 2008 Annual Report Download - page 56
Download and view the complete annual report
Please find page 56 of the 2008 Samsung annual report below. You can navigate through the pages in the report by either clicking on the pages listed below, or by using the keyword search tool below to find specific information within the annual report.-
 1
1 -
2
-
3
-
4
-
5
-
6
-
7
-
8
-
9
-
10
-
11
-
12
-
13
-
14
-
15
-
16
-
17
-
18
-
19
-
20
-
21
-
22
-
23
-
24
-
25
-
26
-
27
-
28
-
29
-
30
-
31
-
32
-
33
-
34
-
35
-
36
-
37
-
38
-
39
-
40
-
41
-
42
-
43
-
44
-
45
-
 46
46 -
 47
47 -
 48
48 -
 49
49 -
 50
50 -
 51
51 -
 52
52 -
 53
53 -
 54
54 -
 55
55 -
 56
56 -
 57
57 -
 58
58 -
 59
59 -
 60
60 -
 61
61 -
 62
62 -
 63
63 -
 64
64 -
 65
65 -
 66
66 -
67
-
68
-
69
-
70
-
71
-
72
-
73
-
74
-
75
-
76
-
77
-
78
-
79
-
80
-
81
-
82
-
83
-
84
-
85
-
86
-
87
-
88
-
89
-
90
-
91
-
92
-
93
-
94
-
95
-
96
-
97
-
98
-
99
-
100
-
101
-
102
-
103
-
104
-
105
-
106
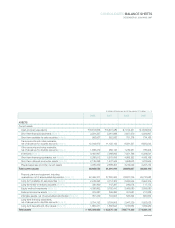
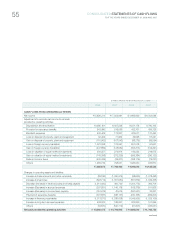
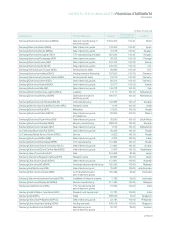
 |
 |

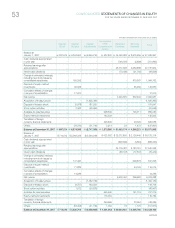
CONSOLIDATED STATEMENTS OF CHANGES IN EQUITY
FOR THE YEARS ENDED DECEMBER 31, 2008 AND 2007
(In millions of Korean won, in thousands of U.S. dollars)
Capital
Stock
Capital
Surplus
Capital
Adjustments
Retained
Earnings
Minority
Interests Total
Accumulated
Other
Comprehensive
Income
Balance at
January 1, 2008
₩
897,514
₩
6,574,995
₩
(8,747,381)
₩
1,875,385
₩
51,065,174
₩
4,306,221
₩
55,971,908
Cash dividends appropriated
in prior year - - - - (1,098,098) (102,138) (1,200,236)
Retained earnings after
appropriations - - - - 49,967,076 4,204,083 54,771,672
Interim cash dividends - - - - (73,411) (41,839) (115,250)
Change in ownership interests,
including new stock issues by
consolidated subsidiaries - 37,370 - - - 221,516 258,886
Cumulative effects of changes
in scope of consolidation - - - - - (318) (318)
Net income - - - - 5,525,904 364,310 5,890,214
Disposal of treasury stock - 4,039 247,357 - - - 251,396
Stock option activities - 2,306 (89,239) - - - (86,933)
Available-for-sale Securities - - - (578,674) - (121,288) (699,962)
Equity-method investments - - - 313 - - 313
Translation of foreign
currency financial statements - - - 2,527,591 - 207,537 2,735,128
Others - (29,849) (7,750) (16,539) 2 (27,056) (81,192)
Balance at December 31, 2008
₩
897,514
₩
6,588,861
₩
(8,597,013)
₩
3,808,076
₩
55,419,571
₩
4,806,945
₩
62,923,954
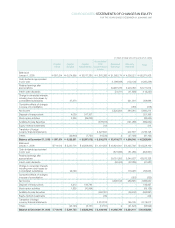
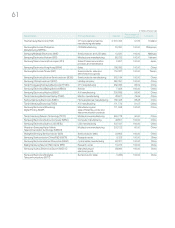
Balance at
January 1, 2008 $ 714,012 $ 5,230,704 $ (6,958,933) $ 1,491,953 $ 40,624,641 $ 3,425,792 $ 44,528,169
Cash dividends appropriated
in prior year - - - - (873,586) (81,255) (954,841)
Retained earnings after
appropriations - - - - 39,751,055 3,344,537 43,573,328
Interim cash dividends - - - - (58,402) (33,285) (91,687)
Change in ownership interests,
including new stock issues by
consolidated subsidiaries - 29,729 - - - 176,226 205,955
Cumulative effects of changes
in scope of consolidation - - - - - (253) (253)
Net income - - - - 4,396,105 289,825 4,685,930
Disposal of treasury stock - 3,213 196,784 - - - 199,997
Stock option activities - 1,835 (70,994) - - - (69,159)
Available-for-sale Securities - - - (460,361) - (96,490) (556,851)
Equity-method investments - - - 249 - - 249
Translation of foreign
currency financial statements - - - 2,010,812 - 165,105 2,175,917
Others - (23,746) (6,167) (13,157) 2 (21,524) (64,592)
Balance at December 31, 2008 $ 714,012 $ 5,241,735 $ (6,839,310) $ 3,029,496 $ 44,088,760 $ 3,824,141 $ 50,058,834