Samsung 2008 Annual Report Download - page 54
Download and view the complete annual report
Please find page 54 of the 2008 Samsung annual report below. You can navigate through the pages in the report by either clicking on the pages listed below, or by using the keyword search tool below to find specific information within the annual report.-
 1
1 -
2
-
3
-
4
-
5
-
6
-
7
-
8
-
9
-
10
-
11
-
12
-
13
-
14
-
15
-
16
-
17
-
18
-
19
-
20
-
21
-
22
-
23
-
24
-
25
-
26
-
27
-
28
-
29
-
30
-
31
-
32
-
33
-
34
-
35
-
36
-
37
-
38
-
39
-
40
-
41
-
42
-
43
-
 44
44 -
 45
45 -
 46
46 -
 47
47 -
 48
48 -
 49
49 -
 50
50 -
 51
51 -
 52
52 -
 53
53 -
 54
54 -
 55
55 -
 56
56 -
 57
57 -
 58
58 -
 59
59 -
 60
60 -
 61
61 -
 62
62 -
 63
63 -
 64
64 -
65
-
66
-
67
-
68
-
69
-
70
-
71
-
72
-
73
-
74
-
75
-
76
-
77
-
78
-
79
-
80
-
81
-
82
-
83
-
84
-
85
-
86
-
87
-
88
-
89
-
90
-
91
-
92
-
93
-
94
-
95
-
96
-
97
-
98
-
99
-
100
-
101
-
102
-
103
-
104
-
105
-
106
 |
 |

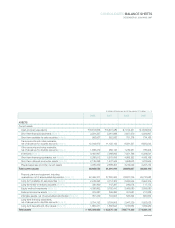
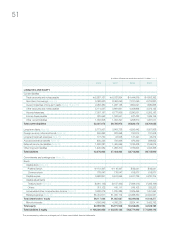
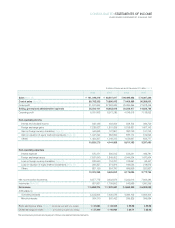
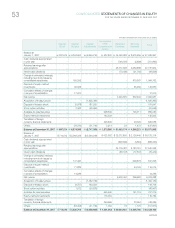
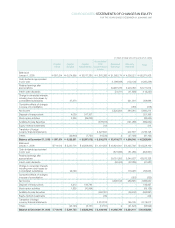
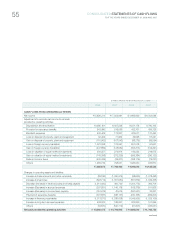
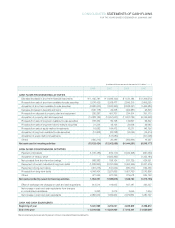
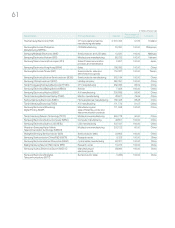
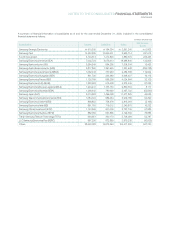
The accompanying notes are an integral part of these consolidated financial statements.
CONSOLIDATED STATEMENTS OF INCOME
YEARS ENDED DECEMBER 31, 2008 AND 2007
(In millions of Korean won and in thousands of U.S. dollars (Note 3))
2008 2007 2008 2007
Sales (Note 28)
₩
121,294,319
₩
98,507,817 $ 96,495,083 $ 78,367,396
Cost of sales (Note 28) 89,762,355 70,880,912 71,409,988 56,388,951
Gross profit 31,531,964 27,626,905 25,085,095 21,978,445
Selling, general and administrative expenses 25,500,101 18,653,619 20,286,477 14,839,793
Operating profit 6,031,863 8,973,286 4,798,618 7,138,652
Non-operating income
Interest and dividend income 639,439 483,604 508,702 384,729
Foreign exchange gains 7,238,637 1,831,629 5,758,661 1,457,143
Gain on foreign currency translation (Note 31) 444,663 127,891 353,749 101,743
Gain on valuation of equity method investments (Note 10) 1,047,224 652,500 833,114 519,093
Others 1,454,307 1,049,315 1,156,967 834,777
10,824,270 4,144,939 8,611,193 3,297,485
Non-operating expenses
Interest expense 670,271 590,515 533,231 469,781
Foreign exchange losses 7,597,640 1,849,002 6,044,264 1,470,964
Loss on foreign currency translation (Note 31) 933,940 116,231 742,991 92,467
Loss on valuation of equity method investments (Note 10) 209,357 274,874 166,553 218,675
Others 867,150 654,730 689,856 520,867
10,278,358 3,485,352 8,176,895 2,772,754
Net income before income tax 6,577,775 9,632,873 5,232,916 7,663,383
Income tax (Note 25) 687,561 1,709,892 546,986 1,360,295
Net income
₩
5,890,214
₩
7,922,981 $ 4,685,930 $ 6,303,088
Attributable to:
Controlling interests 5,525,904 7,420,579 4,396,105 5,903,404
Minority interests 364,310 502,402 289,825 399,684
Basic earnings per share (Note 26) (in Korean won and U.S. dollars)
₩
37,684
₩
49,502 $ 29.98 $ 39.38
Diluted earnings per share (Note 26) (in Korean won and U.S. dollars)
₩
37,340
₩
48,924 $ 29.71 $ 38.92