Samsung 2008 Annual Report Download - page 52
Download and view the complete annual report
Please find page 52 of the 2008 Samsung annual report below. You can navigate through the pages in the report by either clicking on the pages listed below, or by using the keyword search tool below to find specific information within the annual report.-
 1
1 -
2
-
3
-
4
-
5
-
6
-
7
-
8
-
9
-
10
-
11
-
12
-
13
-
14
-
15
-
16
-
17
-
18
-
19
-
20
-
21
-
22
-
23
-
24
-
25
-
26
-
27
-
28
-
29
-
30
-
31
-
32
-
33
-
34
-
35
-
36
-
37
-
38
-
39
-
40
-
41
-
 42
42 -
 43
43 -
 44
44 -
 45
45 -
 46
46 -
 47
47 -
 48
48 -
 49
49 -
 50
50 -
 51
51 -
 52
52 -
 53
53 -
 54
54 -
 55
55 -
 56
56 -
 57
57 -
 58
58 -
 59
59 -
 60
60 -
 61
61 -
 62
62 -
63
-
64
-
65
-
66
-
67
-
68
-
69
-
70
-
71
-
72
-
73
-
74
-
75
-
76
-
77
-
78
-
79
-
80
-
81
-
82
-
83
-
84
-
85
-
86
-
87
-
88
-
89
-
90
-
91
-
92
-
93
-
94
-
95
-
96
-
97
-
98
-
99
-
100
-
101
-
102
-
103
-
104
-
105
-
106
 |
 |
continued
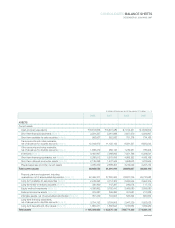
CONSOLIDATED BALANCE SHEETS
DECEMBER 31, 2008 AND 2007
(In millions of Korean won and in thousands of U.S. dollars (Note 3))
2008 2007 2008 2007
ASSETS
Current assets
Cash and cash equivalents
₩
8,814,638
₩
5,831,989 $ 7,012,441 $ 4,639,609
Short-term financial instruments (Note 4) 3,591,337 5,061,898 2,857,070 4,026,967
Short-term available-for-sale securities (Note 5) 982,067 922,833 781,278 734,155
Trade accounts and notes receivable,
net of allowance for doubtful accounts (Note 6) 12,043,979 11,125,132 9,581,527 8,850,543
Other accounts and notes receivable,
net of allowance for doubtful accounts (Note 6) 1,558,279 989,143 1,239,681 786,908
Inventories (Note 7) 9,492,607 7,968,803 7,551,796 6,339,541
Short-term financing receivables, net (Note 8) 6,266,512 5,575,006 4,985,292 4,435,168
Short-term deferred income tax assets (Note 25) 2,135,068 1,537,946 1,698,543 1,223,505
Prepaid expenses and other current assets 4,084,069 2,888,264 3,249,059 2,297,744
Total current assets 48,968,556 41,901,014 38,956,687 33,334,140
Property, plant and equipment, including
revaluations, net of accumulated depreciation (Note 11) 42,496,311 37,380,644 33,807,726 29,737,982
Long-term available-for-sale securities (Note 9) 2,618,262 3,712,322 2,082,945 2,953,319
Long-term held-to-maturity securities (Note 9) 334,460 147,287 266,078 117,173
Equity-method investments (Note 10) 4,356,862 3,782,413 3,466,080 3,009,080
Deferred income tax assets (Note 25) 379,087 266,280 301,581 211,838
Intangible assets, net of accumulated amortization (Note 12) 787,249 704,627 626,292 560,562
Long-term financing receivables,
net of allowance for doubtful accounts (Note 8) 3,704,792 3,799,955 2,947,329 3,023,035
Long-term deposits and other assets (Note 13) 1,655,071 1,680,594 1,316,682 1,336,989
Total assets
₩
105,300,650
₩
93,375,136 $ 83,771,400 $ 74,284,118