Samsung 2008 Annual Report Download - page 59
Download and view the complete annual report
Please find page 59 of the 2008 Samsung annual report below. You can navigate through the pages in the report by either clicking on the pages listed below, or by using the keyword search tool below to find specific information within the annual report.-
 1
1 -
2
-
3
-
4
-
5
-
6
-
7
-
8
-
9
-
10
-
11
-
12
-
13
-
14
-
15
-
16
-
17
-
18
-
19
-
20
-
21
-
22
-
23
-
24
-
25
-
26
-
27
-
28
-
29
-
30
-
31
-
32
-
33
-
34
-
35
-
36
-
37
-
38
-
39
-
40
-
41
-
42
-
43
-
44
-
45
-
46
-
47
-
48
-
 49
49 -
 50
50 -
 51
51 -
 52
52 -
 53
53 -
 54
54 -
 55
55 -
 56
56 -
 57
57 -
 58
58 -
 59
59 -
 60
60 -
 61
61 -
 62
62 -
 63
63 -
 64
64 -
 65
65 -
 66
66 -
 67
67 -
 68
68 -
 69
69 -
70
-
71
-
72
-
73
-
74
-
75
-
76
-
77
-
78
-
79
-
80
-
81
-
82
-
83
-
84
-
85
-
86
-
87
-
88
-
89
-
90
-
91
-
92
-
93
-
94
-
95
-
96
-
97
-
98
-
99
-
100
-
101
-
102
-
103
-
104
-
105
-
106
 |
 |

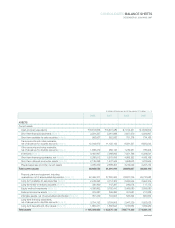
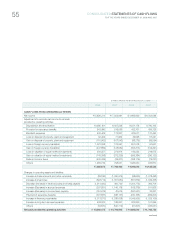
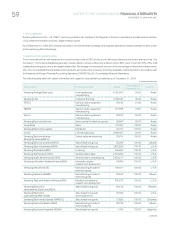
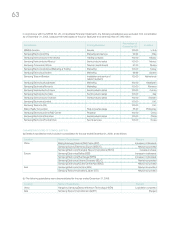
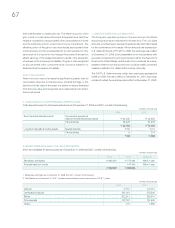
CONSOLIDATED INCOME STATEMENT
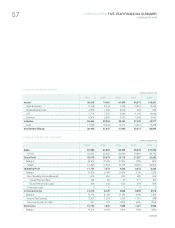
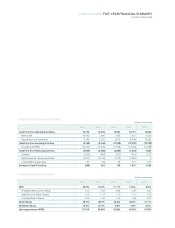
CONSOLIDATED FIVE-YEAR FINANCIAL SUMMARY
CONSOLIDATED BASE
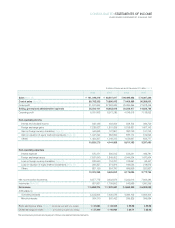
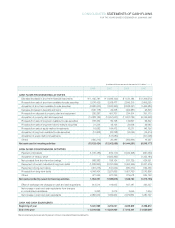
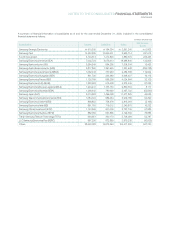
Assets 69,005 74,462 81,366 93,375 105,301
Cash & Cash Eq. 8,108 8,144 7,726 10,894 12,406
Marketable Securities 2,868 1,932 2,059 923 982
A/R 6,774 7,397 9,089 11,125 12,044
Inventory 5,804 5,865 6,753 7,969 9,493
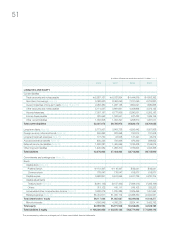
Liabilities 32,604 32,854 33,426 37,403 42,377
Debt 17,654 16,432 14,477 14,514 17,455
Stockholder’s Equity 36,400 41,607 47,940 55,972 62,924
2004 2005 2006 2007 2008
CONSOLIDATED BALANCE SHEET
(In billions of Korean won)
(In billions of Korean won)
continued
Sales 81,963 80,630 85,426 98,508 121,294
- COGS 52,953 55,252 59,652 70,881 89,762
Gross Profit 29,010 25,378 25,773 27,627 31,532
(Margin) 35.4% 31.5% 30.2% 28% 26%
- SG&A 17,250 17,802 16,766 18,654 25,500
Operating Profit 11,761 7,575 9,008 8,973 6,032
(Margin) 14.3% 9.4% 10.5% 9.1% 5.0%
- Non Operating Income (Expense) 615 550 820 660 546
Interest Payment (Net) 192 66 70 171 (56)
Equity Method Gain (Loss) 496 342 520 378 838
- Extra Gain (Loss) 0 0 0 0 0
Income before tax 12,376 8,125 9,828 9,633 6,578
(Margin) 15.1% 10.1% 11.5% 9.8% 5.4%
- Income Tax Expense 2,207 1,218 1,634 1,710 688
- Minority Interests, etc. (Net) 621 733 (268) (502) (364)
Net Income 10,790 7,640 7,926 7,421 5,526
(Margin) 13.2% 9.5% 9.3% 7.5% 4.6%
2004 2005 2006 2007 2008