Samsung 2008 Annual Report Download - page 97
Download and view the complete annual report
Please find page 97 of the 2008 Samsung annual report below. You can navigate through the pages in the report by either clicking on the pages listed below, or by using the keyword search tool below to find specific information within the annual report.-
 1
1 -
2
-
3
-
4
-
5
-
6
-
7
-
8
-
9
-
10
-
11
-
12
-
13
-
14
-
15
-
16
-
17
-
18
-
19
-
20
-
21
-
22
-
23
-
24
-
25
-
26
-
27
-
28
-
29
-
30
-
31
-
32
-
33
-
34
-
35
-
36
-
37
-
38
-
39
-
40
-
41
-
42
-
43
-
44
-
45
-
46
-
47
-
48
-
49
-
50
-
51
-
52
-
53
-
54
-
55
-
56
-
57
-
58
-
59
-
60
-
61
-
62
-
63
-
64
-
65
-
66
-
67
-
68
-
69
-
70
-
71
-
72
-
73
-
74
-
75
-
76
-
77
-
78
-
79
-
80
-
81
-
82
-
83
-
84
-
85
-
86
-
 87
87 -
 88
88 -
 89
89 -
 90
90 -
 91
91 -
 92
92 -
 93
93 -
 94
94 -
 95
95 -
 96
96 -
 97
97 -
 98
98 -
 99
99 -
 100
100 -
 101
101 -
 102
102 -
 103
103 -
 104
104 -
 105
105 -
 106
106
 |
 |
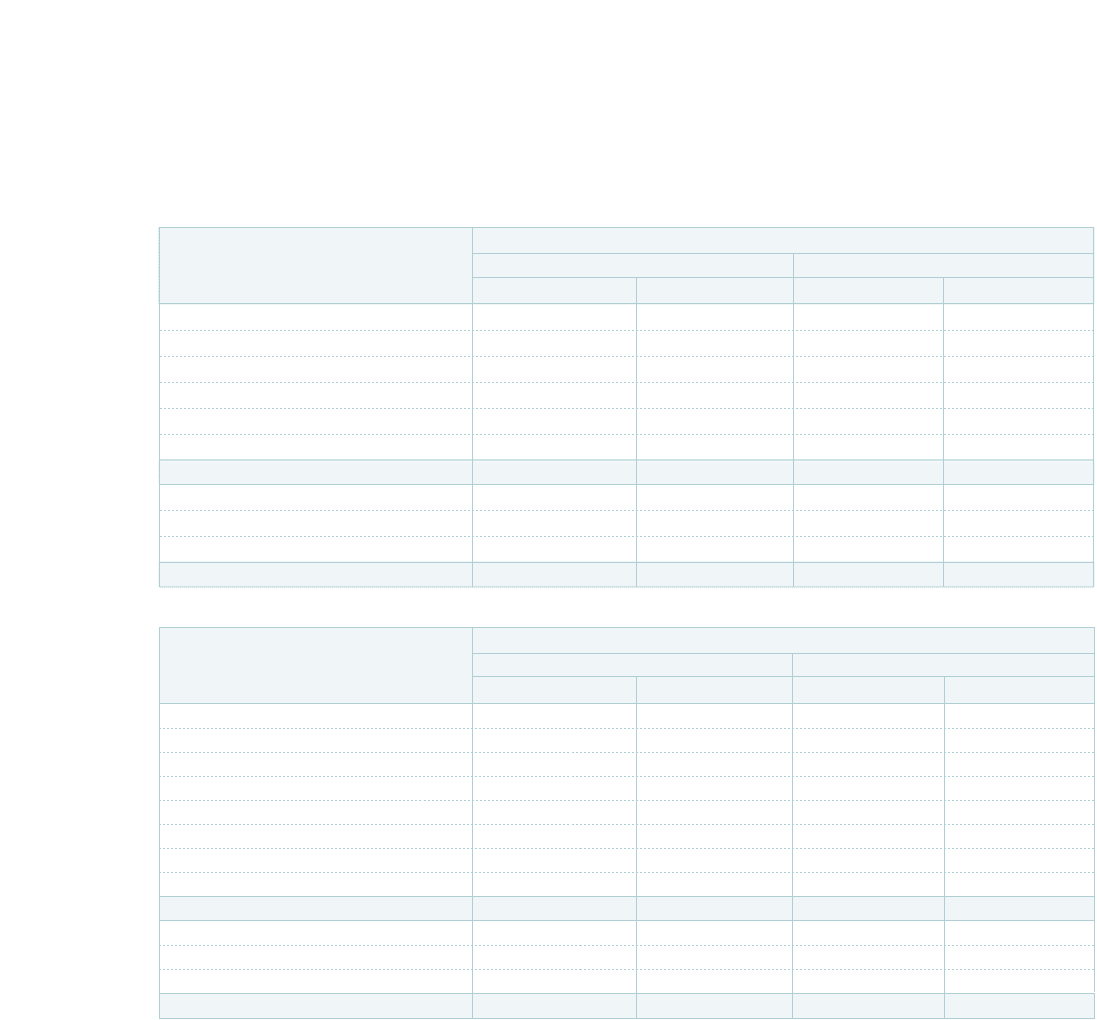
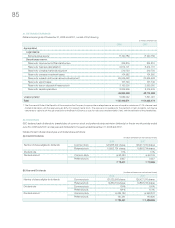
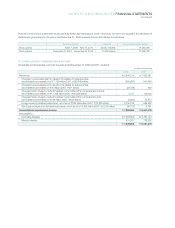
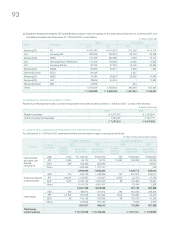
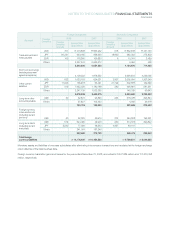
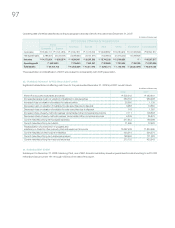
32. SEGMENT INFORMATION
A summary of consolidated financial data by industry as of December 31, 2008 and 2007, and for the years then ended, are follows:
(In millions of Korean won)
(In millions of Korean won)
Assets
Current assets
₩
40,405,529
₩
35,437,169
₩
8,562,959
₩
6,464,785
Investments 7,255,750 7,497,133 5,570,976 5,727,153
Property, plant and equipment 42,448,832 37,336,483 48,364 45,100
Intangible assets 741,346 645,247 45,943 59,429
Other non-current assets 1,465,850 1,394,431 205,393 197,410
Total assets
₩
92,317,307
₩
82,310,463
₩
14,433,635
₩
12,493,877
Liabilities
Current liabilities
₩
27,345,976
₩
24,976,013
₩
4,861,094
₩
4,819,963
Non-current liabilities 4,366,119 3,492,217 5,803,507 4,115,035
Total liabilities
₩
31,712,095
₩
28,468,230
₩
10,664,601
₩
8,934,998
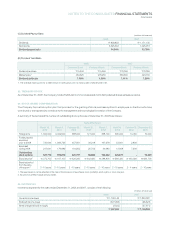
Consolidated Balance Sheets by Industry
Non-financial Business Financial Business
2008 2007 2008 2007
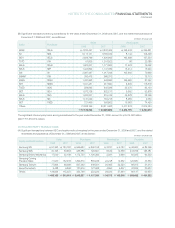
Sales
₩
118,376,276
₩
96,090,565
₩
2,926,714
₩
2,426,287
Cost of sales 88,526,410 69,940,425 1,236,017 939,409
Selling, general and administrative expenses 24,141,296 17,681,817 1,367,467 981,220
Operating profit 5,708,570 8,468,323 323,230 505,658
Non-operating income 10,860,880 4,157,704 68,562 183,424
Non-operating expenses 10,255,568 3,482,316 22,791 3,318
Income before income tax 6,313,882 9,143,711 369,001 685,764
Income tax expense 616,473 1,555,717 71,088 154,175
Net income
₩
5,697,409
₩
7,587,994
₩
297,913
₩
531,589
Attributable to:
Controlling interests 5,525,904 7,420,579
Minority interests 171,505 167,415
₩
5,697,409
₩
7,587,994
Consolidated Statements of Income by Industry
Non-financial Business Financial Business
2008 2007 2008 2007
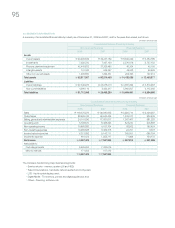
The Company has following major business segments:
• Semiconductor - memory, system LSI and HDD;
• Telecommunications - handsets, network system and computers;
• LCD - liquid crystal display panel;
• Digital Media - TV, monitors, printers and digital appliances; and
• Others - financing, software, etc.