Samsung 2008 Annual Report Download - page 89
Download and view the complete annual report
Please find page 89 of the 2008 Samsung annual report below. You can navigate through the pages in the report by either clicking on the pages listed below, or by using the keyword search tool below to find specific information within the annual report.-
 1
1 -
2
-
3
-
4
-
5
-
6
-
7
-
8
-
9
-
10
-
11
-
12
-
13
-
14
-
15
-
16
-
17
-
18
-
19
-
20
-
21
-
22
-
23
-
24
-
25
-
26
-
27
-
28
-
29
-
30
-
31
-
32
-
33
-
34
-
35
-
36
-
37
-
38
-
39
-
40
-
41
-
42
-
43
-
44
-
45
-
46
-
47
-
48
-
49
-
50
-
51
-
52
-
53
-
54
-
55
-
56
-
57
-
58
-
59
-
60
-
61
-
62
-
63
-
64
-
65
-
66
-
67
-
68
-
69
-
70
-
71
-
72
-
73
-
74
-
75
-
76
-
77
-
78
-
 79
79 -
 80
80 -
 81
81 -
 82
82 -
 83
83 -
 84
84 -
 85
85 -
 86
86 -
 87
87 -
 88
88 -
 89
89 -
 90
90 -
 91
91 -
 92
92 -
 93
93 -
 94
94 -
 95
95 -
 96
96 -
 97
97 -
 98
98 -
 99
99 -
100
-
101
-
102
-
103
-
104
-
105
-
106
 |
 |
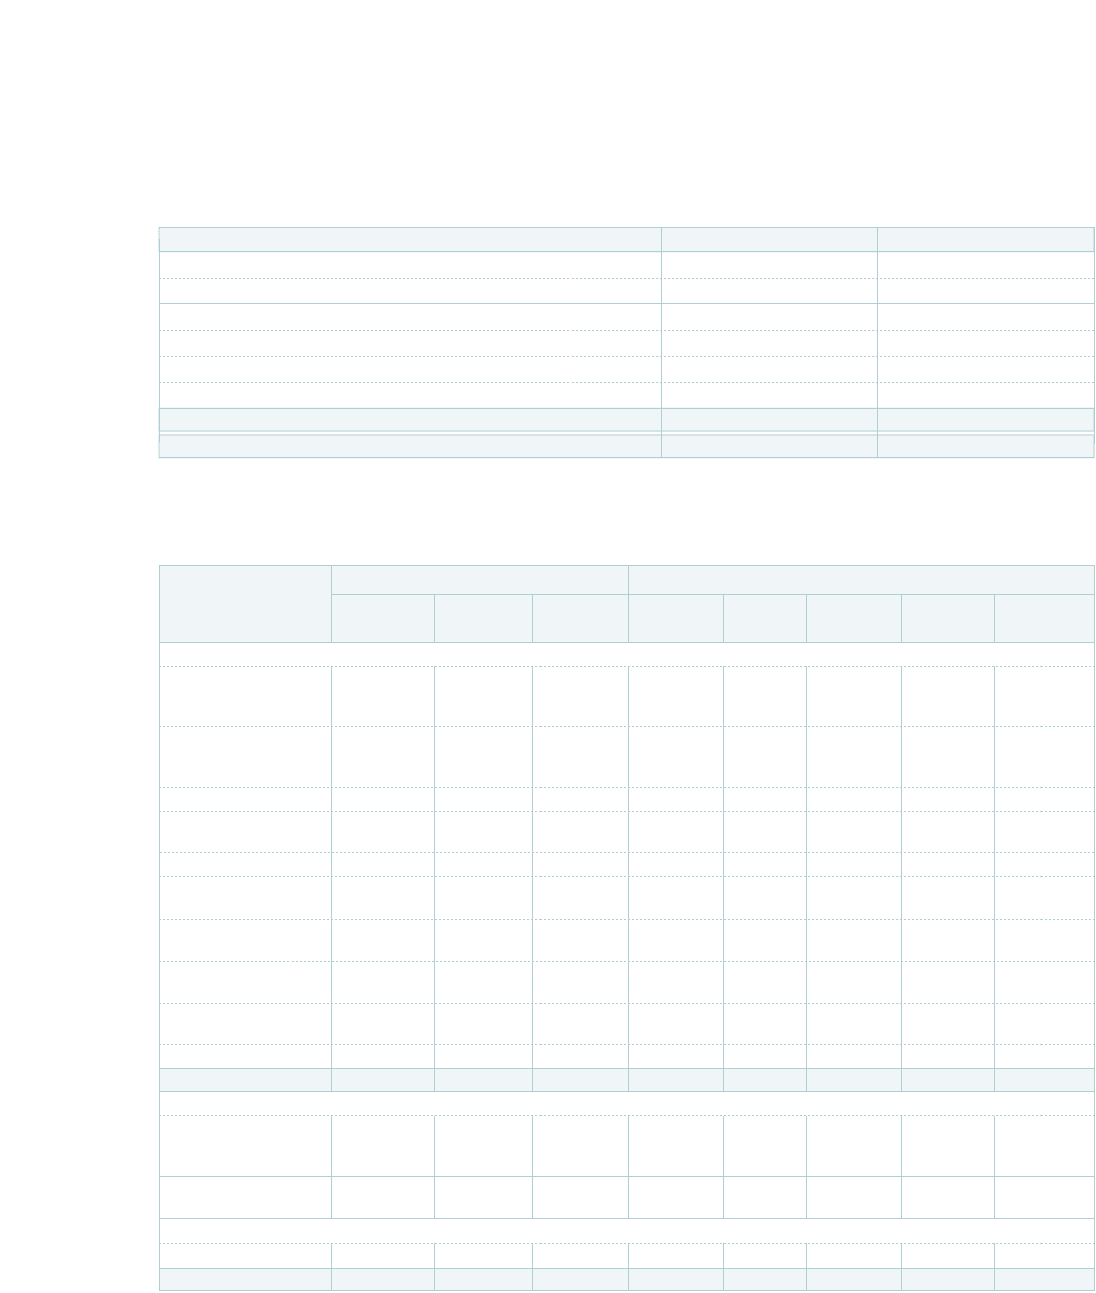
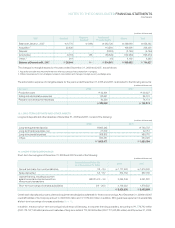
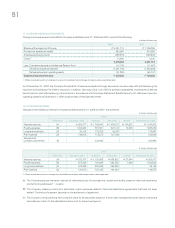
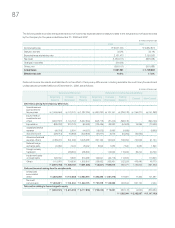
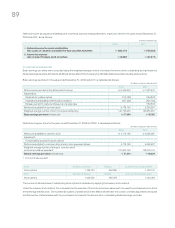
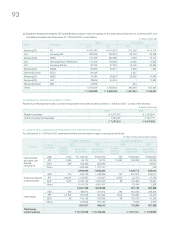
The following table reconciles the expected amount of income tax expense based on statutory rates to the actual amount of taxes recorded
by the Company for the years ended December 31, 2008 and 2007:
(In millions of Korean won)
Income before tax
₩
6,577,775
₩
9,632,873
Statutory tax rate 32.9% 33.1%
Expected taxes at statutory rate 2,161,473 3,193,028
Tax credit (1,084,311) (981,548)
Changes in tax rates (34,444) -
Others, net (355,157) (501,588)
Actual taxes
₩
687,561
₩
1,709,892
Effective tax rate 10.5% 17.8%
2008 2007
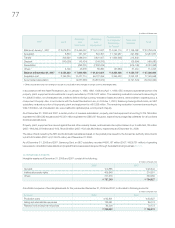
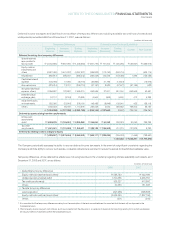
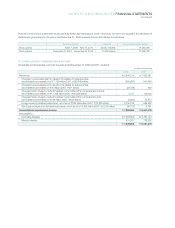
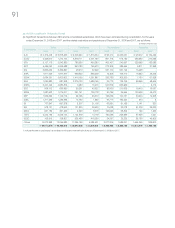
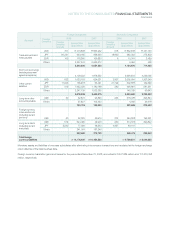
Deferred income tax assets and liabilities from tax effect of temporary differences including available tax credit carryforwards and
undisposed accumulated deficit as of December 31, 2008, are as follows:
(In millions of Korean won)
Temporary Differences Deferred Income Tax Asset (Liabilities)
Beginning Increase Ending Beginning Increase Ending
Balance (Decrease) Balance Balance (Decrease) Balance Current Non-Current
Deferred tax arising from temporary differences
Special reserves
appropriated for
tax purposes
₩
(1,455,564)
₩
173,270
₩
(1,282,294)
₩
(400,280)
₩
104,151
₩
(296,129)
₩
(154,271)
₩
(141,858)
Equity-method
investments and
others (4,097,827) (1,124,707) (5,222,534) (508,715) (87,415) (596,130) - (596,130)
Depreciation (369,242) 310,779 (58,463) (123,485) 68,982 (54,503) 15,995 (70,498)
Capitalized interest
expense (49,718) 5,691 (44,027) (13,673) 3,988 (9,685) - (9,685)
Accrued income (209,713) (13,892) (223,605) (57,577) 3,513 (54,064) (54,064) -
Allowance (technical
expense, others) 2,485,219 841,039 3,326,258 691,150 154,903 846,053 754,929 91,124
Deferred foreign
exchange gains 20,959 7,443 28,402 5,840 1,680 7,520 5,630 1,890
Foreign currency
translation - 486,833 486,833 - 115,933 115,933 85,224 30,709
Impairment losses
on investments 508,150 8,808 516,958 139,541 (25,718) 113,823 - 113,823
Others 1,115,978 734,838 1,850,816 258,692 263,561 522,253 473,480 48,773
₩
(2,051,758)
₩
1,430,102
₩
(621,656)
₩
(8,507)
₩
603,578 595,071 1,126,923 (531,852)
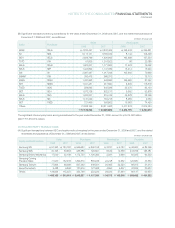
Deferred tax assets arising from the carryforwards
Undisposed
accumulated
deficit
₩
3,226,268
₩
(772,852)
₩
2,453,416
₩
306,323
₩
(127,372) 178,951 77,464 101,487
Tax credit
carryforwards
₩
1,240,611
₩
101,504
₩
1,342,115
₩
791,219
₩
142,325 933,544 931,120 2,424
Deferred tax relating to items charged to equity
₩
(3,562,501)
₩
(1,615,393)
₩
(5,177,894)
₩
(755,003)
₩
72,831 (682,172) (2,920) (679,252)
₩
1,025,394
₩
2,132,587
₩
(1,107,193)