Samsung 2008 Annual Report Download - page 60
Download and view the complete annual report
Please find page 60 of the 2008 Samsung annual report below. You can navigate through the pages in the report by either clicking on the pages listed below, or by using the keyword search tool below to find specific information within the annual report.-
 1
1 -
2
-
3
-
4
-
5
-
6
-
7
-
8
-
9
-
10
-
11
-
12
-
13
-
14
-
15
-
16
-
17
-
18
-
19
-
20
-
21
-
22
-
23
-
24
-
25
-
26
-
27
-
28
-
29
-
30
-
31
-
32
-
33
-
34
-
35
-
36
-
37
-
38
-
39
-
40
-
41
-
42
-
43
-
44
-
45
-
46
-
47
-
48
-
49
-
 50
50 -
 51
51 -
 52
52 -
 53
53 -
 54
54 -
 55
55 -
 56
56 -
 57
57 -
 58
58 -
 59
59 -
 60
60 -
 61
61 -
 62
62 -
 63
63 -
 64
64 -
 65
65 -
 66
66 -
 67
67 -
 68
68 -
 69
69 -
 70
70 -
71
-
72
-
73
-
74
-
75
-
76
-
77
-
78
-
79
-
80
-
81
-
82
-
83
-
84
-
85
-
86
-
87
-
88
-
89
-
90
-
91
-
92
-
93
-
94
-
95
-
96
-
97
-
98
-
99
-
100
-
101
-
102
-
103
-
104
-
105
-
106
 |
 |
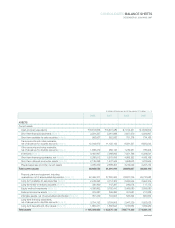
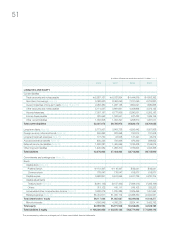
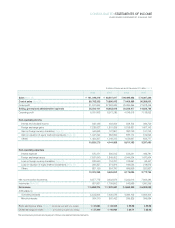
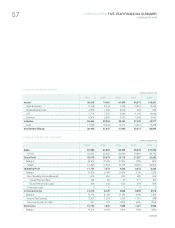
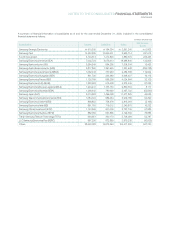
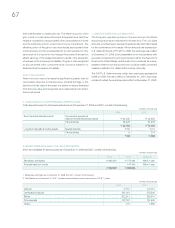
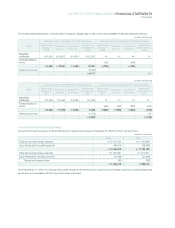
CONSOLIDATED FIVE-YEAR FINANCIAL SUMMARY
CONSOLIDATED BASE
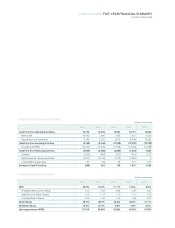
ROE 32.4% 19.6% 17.7 % 14.3% 9.3%
Profitability (Net Income / Sales) 0.13 0.09 0.09 0.08 0.05
Asset Turnover (Sales / Asset) 1.20 1.12 1.10 1.13 1.22
Leverage (Asset / Equity) 2.06 1.84 1.74 1.68 1.67
Debt / Equity 48.5% 39.5% 30.2% 25.9% 27.7%
Net Debt / Equity 18.3% 15.3% 9.8% 4.8% 6.5%
Earnings per share (KRW) 67,916 49,969 52,880 49,502 37,684
2004 2005 2006 2007 2008
CONSOLIDATED FINANCIAL RATIOS
(In billions of Korean won)
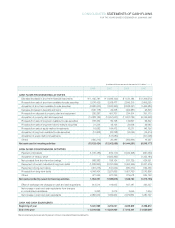
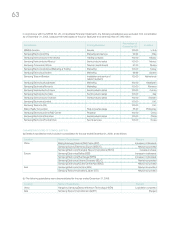
Cash Flow from Operating Activities 16,744 13,329 15,081 14,791 13,360
Net Income 10,790 7,640 7,926 7,421 5,526
Depreciation & Armortization 5,185 6,020 6,873 8,498 10,096
Cash Flow from Investing Activities (8,183) (9,046) (11,098) (12,002) (13,128)
Acquisition of PP&E (10,497) (11,540) (11,738) (12,252) (14,088)
Cash Flow from Financing Activities (9,639) (3,266) (3,889) (1,600) 1,934
Dividend (1,596) (849) (832) (819) 1,315
Rights Issuance / Stock repurchase (3,841) (2,149) (1,813) (1,825) 0
Consolidation adjustments 81 (64) 46 421 817
Increase in Cash & Cash Eq. (996) 953 139 1,610 2,983
2004 2005 2006 2007 2008
CONSOLIDATED CASH FLOW STATEMENT
(In billions of Korean won)