Samsung 2008 Annual Report Download - page 77
Download and view the complete annual report
Please find page 77 of the 2008 Samsung annual report below. You can navigate through the pages in the report by either clicking on the pages listed below, or by using the keyword search tool below to find specific information within the annual report.-
 1
1 -
2
-
3
-
4
-
5
-
6
-
7
-
8
-
9
-
10
-
11
-
12
-
13
-
14
-
15
-
16
-
17
-
18
-
19
-
20
-
21
-
22
-
23
-
24
-
25
-
26
-
27
-
28
-
29
-
30
-
31
-
32
-
33
-
34
-
35
-
36
-
37
-
38
-
39
-
40
-
41
-
42
-
43
-
44
-
45
-
46
-
47
-
48
-
49
-
50
-
51
-
52
-
53
-
54
-
55
-
56
-
57
-
58
-
59
-
60
-
61
-
62
-
63
-
64
-
65
-
66
-
 67
67 -
 68
68 -
 69
69 -
 70
70 -
 71
71 -
 72
72 -
 73
73 -
 74
74 -
 75
75 -
 76
76 -
 77
77 -
 78
78 -
 79
79 -
 80
80 -
 81
81 -
 82
82 -
 83
83 -
 84
84 -
 85
85 -
 86
86 -
 87
87 -
88
-
89
-
90
-
91
-
92
-
93
-
94
-
95
-
96
-
97
-
98
-
99
-
100
-
101
-
102
-
103
-
104
-
105
-
106
 |
 |
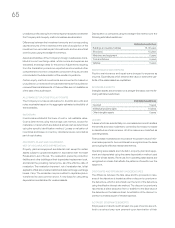
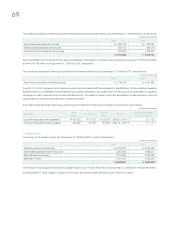
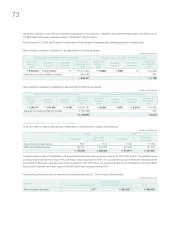
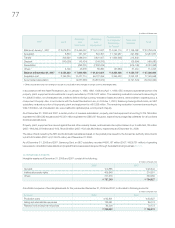
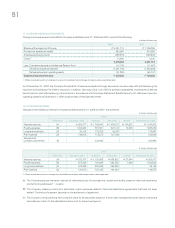
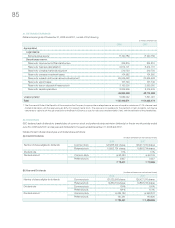
Eliminated unrealized gains and losses as of December 31, 2008 and 2007, are as follows:
Amounts in the table represent eliminated unrealized gains and losses for the years ended December 31, 2008 and 2007, recognized as
part of equity earnings (losses) from equity method investments.
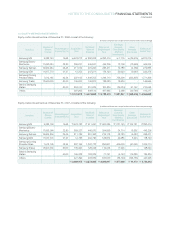
(In millions of Korean won)
Property, Plant Property, Plant
and Equipment and Equipment
Inventories and Intangible Total Inventories and Intangible Total
Assets Assets
2008 2007
Samsung SDI
₩
(645)
₩
170
₩
(475)
₩
1,810
₩
(14,236)
₩
(12,426)
Samsung Electro-Mechanics 3,125 8 3,133 8,516 239 8,755
Samsung Techwin 345 110 455 (2,407) 194 (2,213)
Samsung SDS (12) 779 767 676 500 1,176
Samsung Corning Precision
Glass (28,678) (7,219) (35,897) (2,141) (4,951) (7,092)
Others 395 312 707 139 443 582
₩
(25,470)
₩
(5,840
)
₩
(31,310)
₩
6,593
₩
(17,811)
₩
(11,218
)
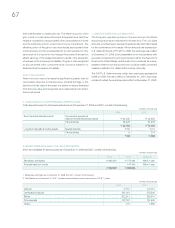
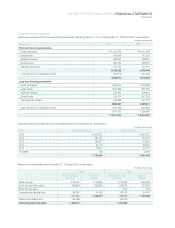
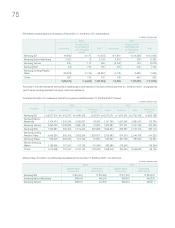
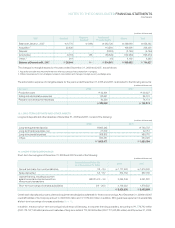
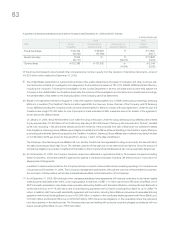
Financial information of investees as of and for the years ended December 31, 2008 and 2007, follows:
(In millions of Korean won)
2008 2007
Investee Net Income Net Income
Assets Liabilities Sales (Loss) Assets Liabilities Sales (Loss)
Samsung SDI
₩
5,977,519
₩
1,440,231
₩
4,649,465
₩
38,874
₩
6,570,071
₩
1,936,904
₩
3,792,465
₩
(592,183)
Samsung Electro-
Mechanics 3,194,434 1,240,349 3,099,821 48,080 3,191,355 1,223,959 2,690,431 112,789
Samsung Techwin 2,390,100 1,308,833 3,595,145 73,623 1,900,287 873,731 3,243,196 203,209
Samsung SDS 1,796,987 634,455 2,519,425 232,968 1,599,974 646,587 2,164,100 226,179
Samsung Corning
Precision Glass 4,946,350 605,129 3,852,299 1,828,627 3,736,683 674,303 2,244,348 974,232
Samsung Thales 558,973 265,033 575,199 37,851 536,827 280,738 480,690 23,847
Siltronic Samsung
Wafers 1,189,880 767,931 132,128 (70,064) 588,584 218,946 - (18,293)
Others 1,910,088 733,441 3,707,142 128,818 1,968,300 794,204 3,446,534 95,146
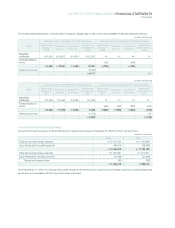
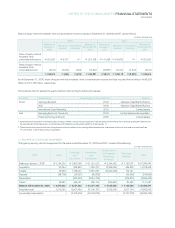
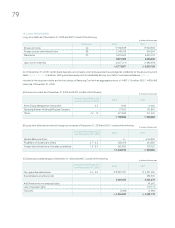
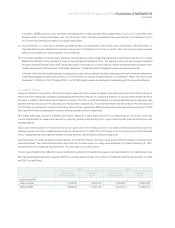
Market value information of publicly listed investees as of December 31, 2008 and 2007, are as follows:
(In millions of Korean won)
Market Value Recorded Market Value Recorded
of Investee Book Value of Investee Book Value
2008 2007
Samsung SDI
₩
510,551
₩
874,079
₩
617,303
₩
893,419
Samsung Electro-Mechanics 589,180 445,244 869,615 445,205
Samsung Techwin 558,721 272,833 826,319 258,411