Samsung 2008 Annual Report Download - page 76
Download and view the complete annual report
Please find page 76 of the 2008 Samsung annual report below. You can navigate through the pages in the report by either clicking on the pages listed below, or by using the keyword search tool below to find specific information within the annual report.-
 1
1 -
2
-
3
-
4
-
5
-
6
-
7
-
8
-
9
-
10
-
11
-
12
-
13
-
14
-
15
-
16
-
17
-
18
-
19
-
20
-
21
-
22
-
23
-
24
-
25
-
26
-
27
-
28
-
29
-
30
-
31
-
32
-
33
-
34
-
35
-
36
-
37
-
38
-
39
-
40
-
41
-
42
-
43
-
44
-
45
-
46
-
47
-
48
-
49
-
50
-
51
-
52
-
53
-
54
-
55
-
56
-
57
-
58
-
59
-
60
-
61
-
62
-
63
-
64
-
65
-
 66
66 -
 67
67 -
 68
68 -
 69
69 -
 70
70 -
 71
71 -
 72
72 -
 73
73 -
 74
74 -
 75
75 -
 76
76 -
 77
77 -
 78
78 -
 79
79 -
 80
80 -
 81
81 -
 82
82 -
 83
83 -
 84
84 -
 85
85 -
 86
86 -
87
-
88
-
89
-
90
-
91
-
92
-
93
-
94
-
95
-
96
-
97
-
98
-
99
-
100
-
101
-
102
-
103
-
104
-
105
-
106
 |
 |

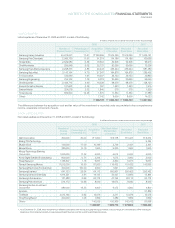
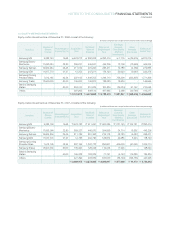
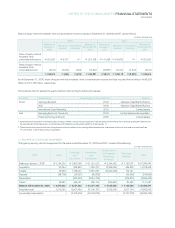
NOTES TO THE CONSOLIDATED FINANCIAL STATEMENTS
CONTINUED
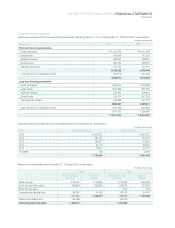
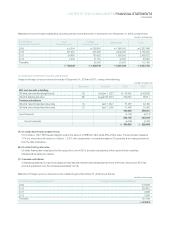
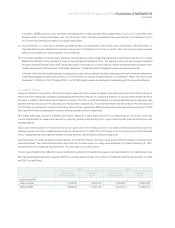
10. EQUITY-METHOD INVESTMENTS
Equity-method investments as of December 31, 2008, consist of the following:
Equity-method investments as of December 31, 2007, consisted of the following:
(In millions of Korean won, except for the number of shares and percentage)
(In millions of Korean won, except for the number of shares and percentage)
Earnings
Number of Net Book Balance at (Losses) Other
Shares Percentage of Acquisition Value of Beginning of From Equity Increase Balance at
Owned Ownership (%) Cost Investee Year -Method (Decrease) End of Year
Investments
Samsung SDI 9,282,753 19.68
₩
423,722
₩
892,938
₩
893,419
₩
7,175
₩
(26,515)
₩
874,079
Samsung Electro-
Mechanics 17,693,084 22.80 359,237 445,531 445,205 13,708 (13,669) 445,244
Samsung Techwin 19,604,254 25.46 211,726 275,290 258,411 19,188 (4,766) 272,833
Samsung SDS 11,977,770 21.27 12,753 247,271 178,123 50,320 (5,067) 223,376
Samsung Corning
Precision Glass 7,512,165 42.54 297,165 1,846,755 1,246,710 758,306 (233,807) 1,771,209
Samsung Thales 13,500,000 50.00 135,000 146,970 128,020 18,936 - 146,956
Siltronic Samsung
Wafers - 50.00 264,410 210,939 184,830 (35,034) 61,152 210,948
Others 397,265 408,134 447,695 5,268 (40,746) 412,217
₩
2,101,278
₩
4,473,828
₩
3,782,413
₩
837,867
₩
(263,418)
₩
4,356,862
Investee
Earnings
Number of Net Book Balance at (Losses) Other
Shares Percentage of Acquisition Value of Beginning of From Equity Increase Balance at
Owned Ownership (%) Cost Investee Year -Method (Decrease) End of Year
Investments
Samsung SDI 9,282,753 19.68
₩
423,722
₩
911,657
₩
920,389
₩
(131,751)
₩
104,781
₩
893,419
Samsung Electro-
Mechanics 17,693,084 22.80 359,237 448,570 394,899 34,714 15,592 445,205
Samsung Techwin 19,604,254 25.46 211,726 261,362 216,118 48,720 (6,427) 258,411
Samsung SDS 11,977,770 21.27 12,753 202,790 125,614 49,285 3,224 178,123
Samsung Corning
Precision Glass 7,512,165 42.54 297,165 1,302,773 894,801 409,000 (57,091) 1,246,710
Samsung Thales 13,500,000 50.00 135,000 128,045 116,075 11,945 - 128,020
Siltronic Samsung
Wafers - 50.00 195,978 184,819 77,751 (9,147) 116,226 184,830
Others 427,394 433,879 647,970 (35,140) (165,135) 447,695
₩
2,062,975
₩
3,873,895
₩
3,393,617
₩
377,626
₩
11,170
₩
3,782,413
Investee