Pottery Barn 2009 Annual Report Download - page 77
Download and view the complete annual report
Please find page 77 of the 2009 Pottery Barn annual report below. You can navigate through the pages in the report by either clicking on the pages listed below, or by using the keyword search tool below to find specific information within the annual report.-
 1
1 -
2
-
3
-
4
-
5
-
6
-
7
-
8
-
9
-
10
-
11
-
12
-
13
-
14
-
15
-
16
-
17
-
18
-
19
-
20
-
21
-
22
-
23
-
24
-
25
-
26
-
27
-
28
-
29
-
30
-
31
-
32
-
33
-
34
-
35
-
36
-
37
-
38
-
39
-
40
-
41
-
42
-
43
-
44
-
45
-
46
-
47
-
48
-
49
-
50
-
51
-
52
-
53
-
54
-
55
-
56
-
57
-
58
-
59
-
60
-
61
-
62
-
63
-
64
-
65
-
66
-
 67
67 -
 68
68 -
 69
69 -
 70
70 -
 71
71 -
 72
72 -
 73
73 -
 74
74 -
 75
75 -
 76
76 -
 77
77 -
 78
78 -
 79
79 -
 80
80 -
 81
81 -
 82
82 -
 83
83 -
 84
84 -
 85
85 -
 86
86 -
 87
87 -
88
-
89
-
90
-
91
-
92
-
93
-
94
-
95
-
96
-
97
-
98
-
99
-
100
-
101
-
102
-
103
-
104
-
105
-
106
-
107
-
108
-
109
-
110
-
111
-
112
-
113
-
114
-
115
-
116
-
117
-
118
-
119
-
120
-
121
-
122
-
123
-
124
-
125
-
126
-
127
-
128
-
129
-
130
-
131
-
132
-
133
-
134
-
135
-
136
-
137
-
138
-
139
-
140
-
141
-
142
-
143
-
144
-
145
-
146
-
147
-
148
-
149
-
150
-
151
-
152
-
153
-
154
-
155
-
156
-
157
-
158
-
159
-
160
-
161
-
162
-
163
-
164
-
165
-
166
-
167
-
168
-
169
-
170
-
171
-
172
-
173
-
174
-
175
-
176
-
177
-
178
-
179
-
180
-
181
-
182
-
183
-
184
-
185
-
186
-
187
-
188
-
189
-
190
-
191
-
192
-
193
-
194
-
195
-
196
-
197
-
198
-
199
-
200
 |
 |

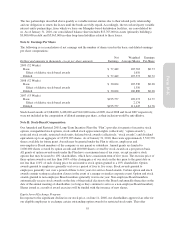
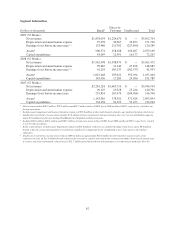
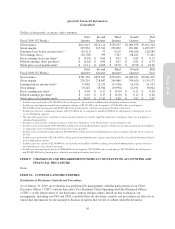
Quarterly Financial Information
(Unaudited)
Dollars in thousands, except per share amounts
Fiscal 2009 (52 Weeks)
First
Quarter
Second
Quarter
Third
Quarter
Fourth
Quarter1
Full
Year
Net revenues $611,615 $672,114 $729,297 $1,089,678 $3,102,704
Gross margin 183,963 215,341 252,852 451,081 1,103,237
Earnings (loss) before income taxes2, 3 (29,511) 57 9,115 140,628 120,289
Net earnings (loss) (18,705) 399 7,327 88,421 77,442
Basic earnings (loss) per share4$ (0.18) $ 0.00 $ 0.07 $ 0.83 $ 0.73
Diluted earnings (loss) per share4$ (0.18) $ 0.00 $ 0.07 $ 0.81 $ 0.72
Stock price (as of quarter-end)5$ 13.11 $ 14.06 $ 18.78 $ 18.98 $ 18.98
Fiscal 2008 (52 Weeks)
First
Quarter6
Second
Quarter7
Third
Quarter8
Fourth
Quarter9
Full
Year
Net revenues $781,784 $819,621 $752,052 $1,008,015 $3,361,472
Gross margin 276,219 278,847 240,480 339,626 1,135,172
Earnings before income taxes10 17,062 25,233 (19,536) 19,194 41,953
Net earnings 10,447 18,384 (10,998) 12,191 30,024
Basic earnings per share4$ 0.10 $ 0.17 $ (0.10) $ 0.12 $ 0.28
Diluted earnings per share4$ 0.10 $ 0.17 $ (0.10) $ 0.12 $ 0.28
Stock price (as of quarter-end)5$ 26.10 $ 17.47 $ 8.28 $ 7.92 $ 7.92
1Includes a pre-tax benefit of $1,900,000 in the fourth quarter representing Visa/MasterCard litigation settlement income.
2Includes pre-tax impairment and lease termination charges of $6,127,000 in the first quarter, $7,246,000 in the second quarter,
$12,156,000 in the third quarter and $9,495,000 in the fourth quarter related to our underperforming retail stores.
3Includes pre-tax lease termination charges of $1,335,000 in the second quarter and $6,245,000 in the third quarter related to the exit of
excess distribution capacity
4The sum of the quarterly net earnings per share amounts will not necessarily equal the annual net earnings per share as each quarter is
calculated independently.
5Stock prices represent our common stock price at the close of business on the Friday before our fiscal quarter-end.
6Includes a net pre-tax benefit of $9,350,000 in selling, general and administrative expense related to an incentive payment from a landlord
to compensate us for terminating a store lease prior to its expiration.
7Includes a pre-tax benefit of approximately $16,000,000 in selling, general and administrative expense related to the sale of our corporate
aircraft.
8Includes a pre-tax benefit of $11,023,000 in selling, general and administrative expense associated with the reversal of performance-based
stock compensation expense.
9Includes a pre-tax expense of $2,390,000 in cost of goods sold and $10,344,000 in selling, general and administrative expense related to
our infrastructure cost reduction program.
10 Includes pre-tax impairment charges of $596,000 in the first quarter, $1,474,000 in the second quarter, $12,280,000 in the third quarter
and $19,645,000 in the fourth quarter related to our underperforming retail stores.
ITEM 9. CHANGES IN AND DISAGREEMENTS WITH ACCOUNTANTS ON ACCOUNTING AND
FINANCIAL DISCLOSURE
None.
ITEM 9A. CONTROLS AND PROCEDURES
Evaluation of Disclosure Controls and Procedures
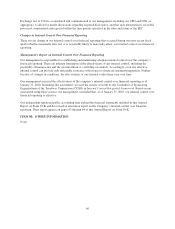
As of January 31, 2010, an evaluation was performed by management, with the participation of our Chief
Executive Officer (“CEO”) and our Executive Vice President, Chief Operating and Chief Financial Officer
(“CFO”), of the effectiveness of our disclosure controls and procedures. Based on that evaluation, our
management, including our CEO and CFO, concluded that our disclosure controls and procedures are effective to
ensure that information we are required to disclose in reports that we file or submit under the Securities
65
Form 10-K