Pottery Barn 2009 Annual Report Download - page 36
Download and view the complete annual report
Please find page 36 of the 2009 Pottery Barn annual report below. You can navigate through the pages in the report by either clicking on the pages listed below, or by using the keyword search tool below to find specific information within the annual report.-
 1
1 -
2
-
3
-
4
-
5
-
6
-
7
-
8
-
9
-
10
-
11
-
12
-
13
-
14
-
15
-
16
-
17
-
18
-
19
-
20
-
21
-
22
-
23
-
24
-
25
-
 26
26 -
 27
27 -
 28
28 -
 29
29 -
 30
30 -
 31
31 -
 32
32 -
 33
33 -
 34
34 -
 35
35 -
 36
36 -
 37
37 -
 38
38 -
 39
39 -
 40
40 -
 41
41 -
 42
42 -
 43
43 -
 44
44 -
 45
45 -
 46
46 -
47
-
48
-
49
-
50
-
51
-
52
-
53
-
54
-
55
-
56
-
57
-
58
-
59
-
60
-
61
-
62
-
63
-
64
-
65
-
66
-
67
-
68
-
69
-
70
-
71
-
72
-
73
-
74
-
75
-
76
-
77
-
78
-
79
-
80
-
81
-
82
-
83
-
84
-
85
-
86
-
87
-
88
-
89
-
90
-
91
-
92
-
93
-
94
-
95
-
96
-
97
-
98
-
99
-
100
-
101
-
102
-
103
-
104
-
105
-
106
-
107
-
108
-
109
-
110
-
111
-
112
-
113
-
114
-
115
-
116
-
117
-
118
-
119
-
120
-
121
-
122
-
123
-
124
-
125
-
126
-
127
-
128
-
129
-
130
-
131
-
132
-
133
-
134
-
135
-
136
-
137
-
138
-
139
-
140
-
141
-
142
-
143
-
144
-
145
-
146
-
147
-
148
-
149
-
150
-
151
-
152
-
153
-
154
-
155
-
156
-
157
-
158
-
159
-
160
-
161
-
162
-
163
-
164
-
165
-
166
-
167
-
168
-
169
-
170
-
171
-
172
-
173
-
174
-
175
-
176
-
177
-
178
-
179
-
180
-
181
-
182
-
183
-
184
-
185
-
186
-
187
-
188
-
189
-
190
-
191
-
192
-
193
-
194
-
195
-
196
-
197
-
198
-
199
-
200
 |
 |
ITEM 7. MANAGEMENT’S DISCUSSION AND ANALYSIS OF FINANCIAL CONDITION AND
RESULTS OF OPERATIONS
The following discussion and analysis of our financial condition, results of operations, and liquidity and capital
resources for the 52 weeks ended January 31, 2010 (“fiscal 2009”), the 52 weeks ended February 1, 2009 (“fiscal
2008”), and the 53 weeks ended February 3, 2008 (“fiscal 2007”) should be read in conjunction with our
consolidated financial statements and notes thereto. All explanations of changes in operational results are
discussed in order of magnitude.
OVERVIEW
Fiscal 2009 Financial Results
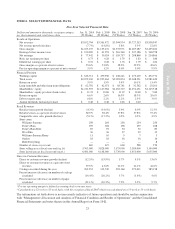
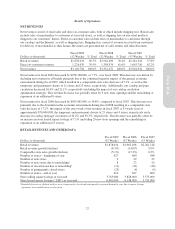
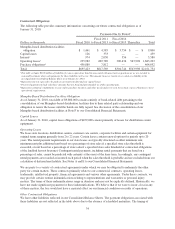
In fiscal 2009, our net revenues decreased 7.7% to $3,102,704,000 from $3,361,472,000 in fiscal 2008. Across
brands, we saw improving sales trends and steadily increasing selling margins throughout the year, which led to
an increase in our diluted earnings per share of 157%, to $0.72 in fiscal 2009 from $0.28 in fiscal 2008. To
generate these results, we delivered the highest operating contribution rate in the history of our
direct-to-customer segment, reduced our selling, general and administrative expense rate, strategically reduced
our inventories to their lowest level in five years (ending the year at $466,124,000), while gaining market share,
and generated more cash in one year than ever before, ending the year with $513,943,000.
Retail net revenues in fiscal 2009 decreased by $84,464,000, or 4.3%, compared to fiscal 2008. This decrease
was primarily due to the continued negative impact of the general economic environment during fiscal 2009,
which resulted in a comparable store sales decrease of 5.1%, as well as the temporary and permanent closure of
11 stores and 23 stores, respectively. This revenue decrease was partially offset by 9 new store openings and the
remodeling or expansion of an additional 8 stores. The net revenue decrease was led by the Pottery Barn and
Pottery Barn Kids brands.
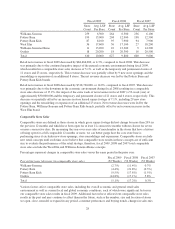
In our direct-to-customer channel, net revenues in fiscal 2009 decreased by $174,304,000, or 12.5%, compared to
fiscal 2008. This decrease was driven by declining net revenues in all brands primarily due to the continued
negative impact of the general economic environment during fiscal 2009. Additionally, our catalog and page
circulation decreased 16.4% and 21.1%, respectively (including the impact of our catalog circulation
optimization strategy).
In our core brands, net revenues decreased by 7.5%, compared to fiscal 2008, driven by declining net revenues in
all brands (led by Pottery Barn and Pottery Barn Kids), due to the continued negative impact of the general
economic environment during fiscal 2009. Comparable store sales decreases were 9.5%, 4.4% and 2.7% for the
Pottery Barn Kids, Pottery Barn and Williams-Sonoma brands, respectively. Although net revenues decreased,
we continued to see economic resilience throughout the year in the Williams-Sonoma brand. Sales trends,
however, improved in the fourth quarter of fiscal 2009, when comparable store sales were positive in all core
brands.
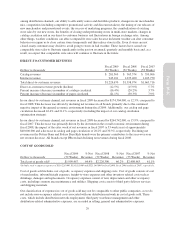
Similar to our core brands, our emerging brands (including West Elm, PBteen and Williams-Sonoma Home) also
continued to be impacted by the general economic environment. Net revenues decreased 9.9% compared to fiscal
2008, driven by declining net revenues in all brands.
In Williams-Sonoma Home, after another difficult year and an extensive review of our strategic alternatives, we
concluded that the future potential of this brand is limited. As such, we are working on a plan to restructure the
unprofitable segments of the business, including the operations of our 11 retail stores. As part of this
restructuring, it is our intent to market those merchandising categories that support our bridal registry, expanded
flagship and designer assortments through the Williams-Sonoma kitchen brand. These categories will be
available both on-line and in select Williams-Sonoma stores.
Fiscal 2009 Operational Results
In supply chain, we saw greater than expected benefits from the distribution, transportation and quality returns
initiatives that we had implemented throughout the year. These initiatives included: implementing distribution
24