Pottery Barn 2009 Annual Report Download - page 141
Download and view the complete annual report
Please find page 141 of the 2009 Pottery Barn annual report below. You can navigate through the pages in the report by either clicking on the pages listed below, or by using the keyword search tool below to find specific information within the annual report.-
 1
1 -
2
-
3
-
4
-
5
-
6
-
7
-
8
-
9
-
10
-
11
-
12
-
13
-
14
-
15
-
16
-
17
-
18
-
19
-
20
-
21
-
22
-
23
-
24
-
25
-
26
-
27
-
28
-
29
-
30
-
31
-
32
-
33
-
34
-
35
-
36
-
37
-
38
-
39
-
40
-
41
-
42
-
43
-
44
-
45
-
46
-
47
-
48
-
49
-
50
-
51
-
52
-
53
-
54
-
55
-
56
-
57
-
58
-
59
-
60
-
61
-
62
-
63
-
64
-
65
-
66
-
67
-
68
-
69
-
70
-
71
-
72
-
73
-
74
-
75
-
76
-
77
-
78
-
79
-
80
-
81
-
82
-
83
-
84
-
85
-
86
-
87
-
88
-
89
-
90
-
91
-
92
-
93
-
94
-
95
-
96
-
97
-
98
-
99
-
100
-
101
-
102
-
103
-
104
-
105
-
106
-
107
-
108
-
109
-
110
-
111
-
112
-
113
-
114
-
115
-
116
-
117
-
118
-
119
-
120
-
121
-
122
-
123
-
124
-
125
-
126
-
127
-
128
-
129
-
130
-
 131
131 -
 132
132 -
 133
133 -
 134
134 -
 135
135 -
 136
136 -
 137
137 -
 138
138 -
 139
139 -
 140
140 -
 141
141 -
 142
142 -
 143
143 -
 144
144 -
 145
145 -
 146
146 -
 147
147 -
 148
148 -
 149
149 -
 150
150 -
 151
151 -
152
-
153
-
154
-
155
-
156
-
157
-
158
-
159
-
160
-
161
-
162
-
163
-
164
-
165
-
166
-
167
-
168
-
169
-
170
-
171
-
172
-
173
-
174
-
175
-
176
-
177
-
178
-
179
-
180
-
181
-
182
-
183
-
184
-
185
-
186
-
187
-
188
-
189
-
190
-
191
-
192
-
193
-
194
-
195
-
196
-
197
-
198
-
199
-
200
 |
 |

This fiscal 2009 proxy peer group was determined by the Compensation Committee considering the following
criteria, which reflected the company’s profile at that time:
1. Company Classification in the Global Sub-Industry Classification System (GICS) in one of the
following:
• Home Furnishing Retail
• Apparel Retail
• Department Stores
2. Revenues between $1 billion and $12 billion
3. Market capitalization greater than $1 billion
4. More than 15,000 employees
Additionally, other major specialty retailers in geographic proximity to the San Francisco Bay Area were
considered for inclusion in the proxy peer group.
By utilizing the criteria described above, the Compensation Committee eliminated seven companies and added
three companies to the proxy peer group for fiscal 2009.
The eliminated companies and the reason(s) for elimination are below:
Company Reason(s) for Elimination
Borders Group Market capitalization too low
Cost Plus Market capitalization too low
Ethan Allen Interiors Not within defined GICS sub-industries; revenue too low; market capitalization too low
Office Depot Not within defined GICS sub-industries; revenue too high
PetSmart Not within defined GICS sub-industries
Starbucks Not within defined GICS sub-industries
Talbots Market capitalization too low
The companies added for fiscal 2009 and the reason(s) for inclusion are below:
Company Reason(s) for Inclusion
Foot Locker Within defined GICS sub-industry, revenue, market capitalization and employee size
Gymboree Within defined GICS sub-industry; San Francisco Bay Area specialty retailer
Saks Within defined GICS sub-industry, revenue, market capitalization and employee size
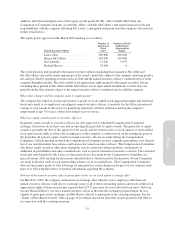
The following table, which is based on publicly available information as of March 29, 2010 as provided by
Cook & Co., provides a financial overview of the comparable companies to illustrate their revenues, income and
market capitalization as a group relative to the company. The Compensation Committee may review additional
benchmarking surveys and proxy data providing summarized data levels of base salary, target annual cash
incentives, and equity-based and other long-term incentives to assess market competitiveness of our
compensation programs for our named executive officers.
Annual
Net Revenue
(in millions)
Annual
Net Income
(in millions)
Market Capitalization
(in millions)
(as of 1/29/10)
75th Percentile ........................................ $7,346 $442 $5,910
Average ............................................. $4,927 $239 $4,081
Median .............................................. $2,991 $102 $2,775
25th Percentile ........................................ $2,271 $ 34 $1,041
Williams-Sonoma, Inc. .................................. $3,103 $ 77 $2,015
The Compensation Committee did not change the proxy peer group for fiscal 2010.
47
Proxy