Pottery Barn 2009 Annual Report Download - page 60
Download and view the complete annual report
Please find page 60 of the 2009 Pottery Barn annual report below. You can navigate through the pages in the report by either clicking on the pages listed below, or by using the keyword search tool below to find specific information within the annual report.-
 1
1 -
2
-
3
-
4
-
5
-
6
-
7
-
8
-
9
-
10
-
11
-
12
-
13
-
14
-
15
-
16
-
17
-
18
-
19
-
20
-
21
-
22
-
23
-
24
-
25
-
26
-
27
-
28
-
29
-
30
-
31
-
32
-
33
-
34
-
35
-
36
-
37
-
38
-
39
-
40
-
41
-
42
-
43
-
44
-
45
-
46
-
47
-
48
-
49
-
 50
50 -
 51
51 -
 52
52 -
 53
53 -
 54
54 -
 55
55 -
 56
56 -
 57
57 -
 58
58 -
 59
59 -
 60
60 -
 61
61 -
 62
62 -
 63
63 -
 64
64 -
 65
65 -
 66
66 -
 67
67 -
 68
68 -
 69
69 -
 70
70 -
71
-
72
-
73
-
74
-
75
-
76
-
77
-
78
-
79
-
80
-
81
-
82
-
83
-
84
-
85
-
86
-
87
-
88
-
89
-
90
-
91
-
92
-
93
-
94
-
95
-
96
-
97
-
98
-
99
-
100
-
101
-
102
-
103
-
104
-
105
-
106
-
107
-
108
-
109
-
110
-
111
-
112
-
113
-
114
-
115
-
116
-
117
-
118
-
119
-
120
-
121
-
122
-
123
-
124
-
125
-
126
-
127
-
128
-
129
-
130
-
131
-
132
-
133
-
134
-
135
-
136
-
137
-
138
-
139
-
140
-
141
-
142
-
143
-
144
-
145
-
146
-
147
-
148
-
149
-
150
-
151
-
152
-
153
-
154
-
155
-
156
-
157
-
158
-
159
-
160
-
161
-
162
-
163
-
164
-
165
-
166
-
167
-
168
-
169
-
170
-
171
-
172
-
173
-
174
-
175
-
176
-
177
-
178
-
179
-
180
-
181
-
182
-
183
-
184
-
185
-
186
-
187
-
188
-
189
-
190
-
191
-
192
-
193
-
194
-
195
-
196
-
197
-
198
-
199
-
200
 |
 |

Fair Value of Financial Instruments
The carrying values of cash and cash equivalents, accounts receivable, investments, accounts payable and debt
approximate their estimated fair values.
Revenue Recognition
We recognize revenues and the related cost of goods sold (including shipping costs) at the time the products are
delivered to our customers. Revenue is recognized for retail sales (excluding home-delivered merchandise) at the
point of sale in the store and for home-delivered merchandise and direct-to-customer sales when the merchandise
is delivered to the customers. Discounts provided to customers are accounted for as a reduction of sales. We
record a reserve for estimated product returns in each reporting period. Shipping and handling fees charged to the
customer are recognized as revenue at the time the products are delivered to the customer. Revenues are
presented net of any taxes collected from customers and remitted to governmental authorities.
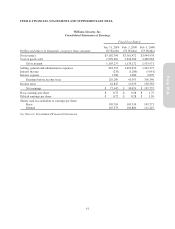
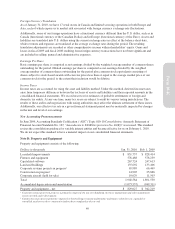
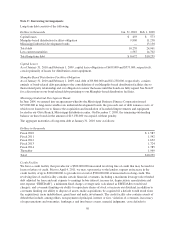
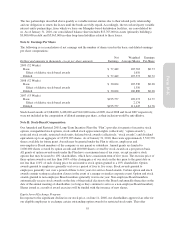
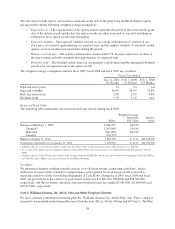
Sales Returns Reserve
Our customers may return purchased items for an exchange or refund. We record a reserve for estimated product
returns, net of cost of goods sold, based on historical return trends together with current product sales
performance. A summary of activity in the sales returns reserve is as follows:
Dollars in thousands
Fiscal 20091
(52 Weeks)
Fiscal 20081
(52 Weeks)
Fiscal 20071
(53 Weeks)
Balance at beginning of year $ 10,142 $ 17,259 $ 15,467
Provision for sales returns 203,053 206,288 277,281
Actual sales returns (201,356) (213,405) (275,489)
Balance at end of year $ 11,839 $ 10,142 $ 17,259
1Amounts are shown net of cost of goods sold.
Vendor Allowances
We receive allowances or credits from certain vendors for volume rebates. We treat such volume rebates as an
offset to the cost of the product or services provided at the time the expense is recorded. These allowances and
credits received are recorded in both cost of goods sold and in selling, general and administrative expenses.
Cost of Goods Sold
Cost of goods sold includes cost of goods, occupancy expenses and shipping costs. Cost of goods consists of cost
of merchandise, inbound freight expenses, freight-to-store expenses and other inventory-related costs such as
shrinkage, damages and replacements. Occupancy expenses consist of rent, depreciation and other occupancy
costs, including common area maintenance and utilities. Shipping costs consist of third party delivery services
and shipping materials.
Selling, General and Administrative Expenses
Selling, general and administrative expenses consist of non-occupancy related costs associated with our retail
stores, distribution warehouses, customer care centers, supply chain operations (buying, receiving and inspection)
and corporate administrative functions. These costs include employment, advertising, third party credit card
processing and other general expenses.
Stock-Based Compensation
We account for stock-based compensation arrangements by measuring and recording compensation expense in
our consolidated financial statements for all stock-based awards using a fair value method. For stock options and
stock-settled stock appreciation rights (“option awards”), fair value is determined using the Black-Scholes
valuation model, while restricted stock units are valued using the closing price of our stock on the date prior to
the date of grant. Significant factors affecting the fair value of option awards include the estimated future
volatility of our stock price and the estimated expected term until the option award is exercised or cancelled. The
fair value of the award is amortized over the requisite service period.
48