Pottery Barn 2009 Annual Report Download - page 41
Download and view the complete annual report
Please find page 41 of the 2009 Pottery Barn annual report below. You can navigate through the pages in the report by either clicking on the pages listed below, or by using the keyword search tool below to find specific information within the annual report.-
 1
1 -
2
-
3
-
4
-
5
-
6
-
7
-
8
-
9
-
10
-
11
-
12
-
13
-
14
-
15
-
16
-
17
-
18
-
19
-
20
-
21
-
22
-
23
-
24
-
25
-
26
-
27
-
28
-
29
-
30
-
 31
31 -
 32
32 -
 33
33 -
 34
34 -
 35
35 -
 36
36 -
 37
37 -
 38
38 -
 39
39 -
 40
40 -
 41
41 -
 42
42 -
 43
43 -
 44
44 -
 45
45 -
 46
46 -
 47
47 -
 48
48 -
 49
49 -
 50
50 -
 51
51 -
52
-
53
-
54
-
55
-
56
-
57
-
58
-
59
-
60
-
61
-
62
-
63
-
64
-
65
-
66
-
67
-
68
-
69
-
70
-
71
-
72
-
73
-
74
-
75
-
76
-
77
-
78
-
79
-
80
-
81
-
82
-
83
-
84
-
85
-
86
-
87
-
88
-
89
-
90
-
91
-
92
-
93
-
94
-
95
-
96
-
97
-
98
-
99
-
100
-
101
-
102
-
103
-
104
-
105
-
106
-
107
-
108
-
109
-
110
-
111
-
112
-
113
-
114
-
115
-
116
-
117
-
118
-
119
-
120
-
121
-
122
-
123
-
124
-
125
-
126
-
127
-
128
-
129
-
130
-
131
-
132
-
133
-
134
-
135
-
136
-
137
-
138
-
139
-
140
-
141
-
142
-
143
-
144
-
145
-
146
-
147
-
148
-
149
-
150
-
151
-
152
-
153
-
154
-
155
-
156
-
157
-
158
-
159
-
160
-
161
-
162
-
163
-
164
-
165
-
166
-
167
-
168
-
169
-
170
-
171
-
172
-
173
-
174
-
175
-
176
-
177
-
178
-
179
-
180
-
181
-
182
-
183
-
184
-
185
-
186
-
187
-
188
-
189
-
190
-
191
-
192
-
193
-
194
-
195
-
196
-
197
-
198
-
199
-
200
 |
 |

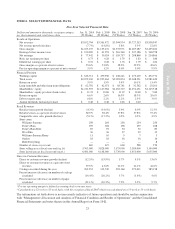
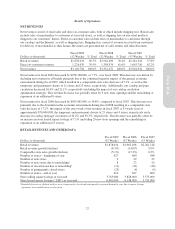
among distribution channels, our ability to efficiently source and distribute products, changes in our merchandise
mix, competition (including competitive promotional activity and discount retailers), the timing of our releases of
new merchandise and promotional events, the success of marketing programs, the cannibalization of existing
store sales by our new stores, the benefits of closing underperforming stores in multi-store markets, changes in
catalog circulation and in our direct-to-customer business and fluctuations in foreign exchange rates. Among
other things, weather conditions can affect comparable store sales because inclement weather can alter consumer
behavior or require us to close certain stores temporarily and thus reduce store traffic. Even if stores are not
closed, many customers may decide to avoid going to stores in bad weather. These factors have caused our
comparable store sales to fluctuate significantly in the past on an annual, quarterly and monthly basis and, as a
result, we expect that comparable store sales will continue to fluctuate in the future.
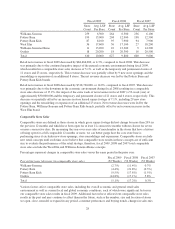
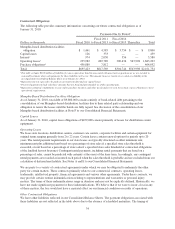
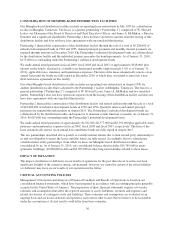
DIRECT-TO-CUSTOMER REVENUES
Dollars in thousands
Fiscal 2009
(52 Weeks)
Fiscal 2008
(52 Weeks)
Fiscal 2007
(53 Weeks)
Catalog revenues $ 281,569 $ 365,574 $ 559,966
Internet revenues 943,101 1,033,400 1,103,750
Total direct-to-customer revenues $1,224,670 $1,398,974 $1,663,716
Direct-to-customer revenue growth (decline) (12.5%) (15.9%) 5.7%
Percent increase (decrease) in number of catalogs circulated (16.4%) (20.2%) 3.7%
Percent increase (decrease) in number of pages circulated (21.1%) (30.3%) 7.9%
In our direct-to-customer channel, net revenues in fiscal 2009 decreased by $174,304,000, or 12.5%, compared to
fiscal 2008. This decrease was driven by declining net revenues in all brands primarily due to the continued
negative impact of the general economic environment during fiscal 2009. Additionally, our catalog and page
circulation decreased 16.4% and 21.1%, respectively (including the impact of our catalog circulation
optimization strategy).
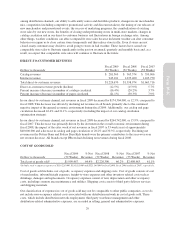
In our direct-to-customer channel, net revenues in fiscal 2008 decreased by $264,742,000, or 15.9%, compared to
fiscal 2007. This decrease was primarily driven by the downturn in the overall economic environment during
fiscal 2008, the impact of the extra week of net revenues in fiscal 2007 (a 53-week year) of approximately
$40,000,000 and a decrease in catalog and page circulation of 20.2% and 30.3%, respectively. Declining net
revenues in the Pottery Barn and Pottery Barn Kids brands were the primary contributors to the year-over-year
net revenue decrease. All brands except PBteen had declining net revenues during fiscal 2008.
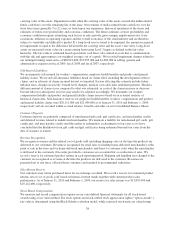
COST OF GOODS SOLD
Dollars in thousands
Fiscal 2009
(52 Weeks)
% Net
Revenues
Fiscal 2008
(52 Weeks)
% Net
Revenues
Fiscal 2007
(53 Weeks)
% Net
Revenues
Total cost of goods sold1$1,999,467 64.4% $2,226,300 66.2% $2,408,963 61.1%
1Includes total occupancy expenses of $519,224,000, $536,181,000 and $521,144,000 in fiscal 2009, fiscal 2008 and fiscal 2007, respectively.
Cost of goods sold includes cost of goods, occupancy expenses and shipping costs. Cost of goods consists of cost
of merchandise, inbound freight expenses, freight-to-store expenses and other inventory related costs such as
shrinkage, damages and replacements. Occupancy expenses consist of rent, depreciation and other occupancy
costs, including common area maintenance and utilities. Shipping costs consist of third party delivery services
and shipping materials.
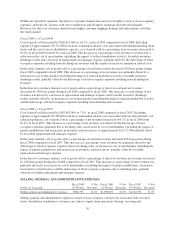
Our classification of expenses in cost of goods sold may not be comparable to other public companies, as we do
not include non-occupancy related costs associated with our distribution network in cost of goods sold. These
costs, which include distribution network employment, third party warehouse management and other
distribution-related administrative expenses, are recorded in selling, general and administrative expenses.
29
Form 10-K