Pottery Barn 2009 Annual Report Download - page 54
Download and view the complete annual report
Please find page 54 of the 2009 Pottery Barn annual report below. You can navigate through the pages in the report by either clicking on the pages listed below, or by using the keyword search tool below to find specific information within the annual report.-
 1
1 -
2
-
3
-
4
-
5
-
6
-
7
-
8
-
9
-
10
-
11
-
12
-
13
-
14
-
15
-
16
-
17
-
18
-
19
-
20
-
21
-
22
-
23
-
24
-
25
-
26
-
27
-
28
-
29
-
30
-
31
-
32
-
33
-
34
-
35
-
36
-
37
-
38
-
39
-
40
-
41
-
42
-
43
-
 44
44 -
 45
45 -
 46
46 -
 47
47 -
 48
48 -
 49
49 -
 50
50 -
 51
51 -
 52
52 -
 53
53 -
 54
54 -
 55
55 -
 56
56 -
 57
57 -
 58
58 -
 59
59 -
 60
60 -
 61
61 -
 62
62 -
 63
63 -
 64
64 -
65
-
66
-
67
-
68
-
69
-
70
-
71
-
72
-
73
-
74
-
75
-
76
-
77
-
78
-
79
-
80
-
81
-
82
-
83
-
84
-
85
-
86
-
87
-
88
-
89
-
90
-
91
-
92
-
93
-
94
-
95
-
96
-
97
-
98
-
99
-
100
-
101
-
102
-
103
-
104
-
105
-
106
-
107
-
108
-
109
-
110
-
111
-
112
-
113
-
114
-
115
-
116
-
117
-
118
-
119
-
120
-
121
-
122
-
123
-
124
-
125
-
126
-
127
-
128
-
129
-
130
-
131
-
132
-
133
-
134
-
135
-
136
-
137
-
138
-
139
-
140
-
141
-
142
-
143
-
144
-
145
-
146
-
147
-
148
-
149
-
150
-
151
-
152
-
153
-
154
-
155
-
156
-
157
-
158
-
159
-
160
-
161
-
162
-
163
-
164
-
165
-
166
-
167
-
168
-
169
-
170
-
171
-
172
-
173
-
174
-
175
-
176
-
177
-
178
-
179
-
180
-
181
-
182
-
183
-
184
-
185
-
186
-
187
-
188
-
189
-
190
-
191
-
192
-
193
-
194
-
195
-
196
-
197
-
198
-
199
-
200
 |
 |

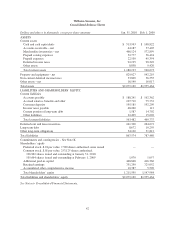
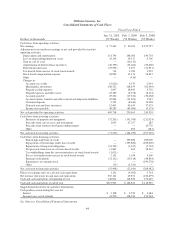
Williams-Sonoma, Inc.
Consolidated Balance Sheets
Dollars and shares in thousands, except per share amounts Jan. 31, 2010 Feb. 1, 2009
ASSETS
Current assets
Cash and cash equivalents $ 513,943 $ 148,822
Accounts receivable – net 44,187 37,405
Merchandise inventories – net 466,124 572,899
Prepaid catalog expenses 32,777 36,424
Prepaid expenses 22,109 45,354
Deferred income taxes 92,195 90,349
Other assets 8,858 9,420
Total current assets 1,180,193 940,673
Property and equipment – net 829,027 942,219
Non-current deferred income taxes 53,809 36,555
Other assets – net 16,140 16,017
Total assets $2,079,169 $1,935,464
LIABILITIES AND SHAREHOLDERS’ EQUITY
Current liabilities
Accounts payable $ 188,241 $ 162,362
Accrued salaries, benefits and other 107,710 75,732
Customer deposits 195,185 192,209
Income taxes payable 48,260 112
Current portion of long-term debt 1,587 14,702
Other liabilities 22,499 15,620
Total current liabilities 563,482 460,737
Deferred rent and lease incentives 241,300 264,672
Long-term debt 8,672 10,259
Other long-term obligations 54,120 51,812
Total liabilities 867,574 787,480
Commitments and contingencies – See Note K
Shareholders’ equity
Preferred stock, $.01 par value, 7,500 shares authorized, none issued — —
Common stock, $.01 par value, 253,125 shares authorized,
106,962 shares issued and outstanding at January 31, 2010;
105,664 shares issued and outstanding at February 1, 2009 1,070 1,057
Additional paid-in capital 448,848 416,366
Retained earnings 751,290 725,052
Accumulated other comprehensive income 10,387 5,509
Total shareholders’ equity 1,211,595 1,147,984
Total liabilities and shareholders’ equity $2,079,169 $1,935,464
See Notes to Consolidated Financial Statements.
42