Pottery Barn 2009 Annual Report Download - page 39
Download and view the complete annual report
Please find page 39 of the 2009 Pottery Barn annual report below. You can navigate through the pages in the report by either clicking on the pages listed below, or by using the keyword search tool below to find specific information within the annual report.-
 1
1 -
2
-
3
-
4
-
5
-
6
-
7
-
8
-
9
-
10
-
11
-
12
-
13
-
14
-
15
-
16
-
17
-
18
-
19
-
20
-
21
-
22
-
23
-
24
-
25
-
26
-
27
-
28
-
 29
29 -
 30
30 -
 31
31 -
 32
32 -
 33
33 -
 34
34 -
 35
35 -
 36
36 -
 37
37 -
 38
38 -
 39
39 -
 40
40 -
 41
41 -
 42
42 -
 43
43 -
 44
44 -
 45
45 -
 46
46 -
 47
47 -
 48
48 -
 49
49 -
50
-
51
-
52
-
53
-
54
-
55
-
56
-
57
-
58
-
59
-
60
-
61
-
62
-
63
-
64
-
65
-
66
-
67
-
68
-
69
-
70
-
71
-
72
-
73
-
74
-
75
-
76
-
77
-
78
-
79
-
80
-
81
-
82
-
83
-
84
-
85
-
86
-
87
-
88
-
89
-
90
-
91
-
92
-
93
-
94
-
95
-
96
-
97
-
98
-
99
-
100
-
101
-
102
-
103
-
104
-
105
-
106
-
107
-
108
-
109
-
110
-
111
-
112
-
113
-
114
-
115
-
116
-
117
-
118
-
119
-
120
-
121
-
122
-
123
-
124
-
125
-
126
-
127
-
128
-
129
-
130
-
131
-
132
-
133
-
134
-
135
-
136
-
137
-
138
-
139
-
140
-
141
-
142
-
143
-
144
-
145
-
146
-
147
-
148
-
149
-
150
-
151
-
152
-
153
-
154
-
155
-
156
-
157
-
158
-
159
-
160
-
161
-
162
-
163
-
164
-
165
-
166
-
167
-
168
-
169
-
170
-
171
-
172
-
173
-
174
-
175
-
176
-
177
-
178
-
179
-
180
-
181
-
182
-
183
-
184
-
185
-
186
-
187
-
188
-
189
-
190
-
191
-
192
-
193
-
194
-
195
-
196
-
197
-
198
-
199
-
200
 |
 |

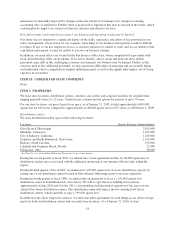
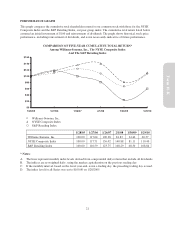
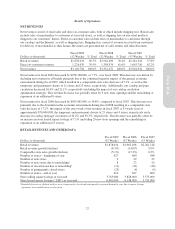
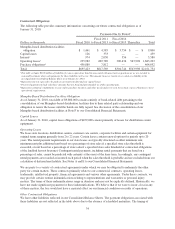
Results of Operations
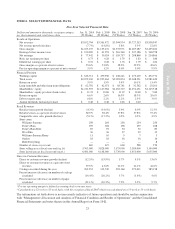
NET REVENUES
Net revenues consist of retail sales and direct-to-customer sales, both of which include shipping fees. Retail sales
include sales of merchandise to customers at our retail stores, as well as shipping fees on any retail products
shipped to our customers’ homes. Direct-to-customer sales include sales of merchandise to customers through
our catalogs and the Internet, as well as shipping fees. Shipping fees consist of revenue received from customers
for delivery of merchandise to their homes. Revenues are presented net of sales returns and other discounts.
Dollars in thousands
Fiscal 2009
(52 Weeks) % Total
Fiscal 2008
(52 Weeks) % Total
Fiscal 2007
(53 Weeks) % Total
Retail revenues $1,878,034 60.5% $1,962,498 58.4% $2,281,218 57.8%
Direct-to-customer revenues 1,224,670 39.5% 1,398,974 41.6% 1,663,716 42.2%
Net revenues $3,102,704 100.0% $3,361,472 100.0% $3,944,934 100.0%
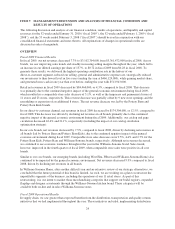
Net revenues for fiscal 2009 decreased by $258,768,000, or 7.7%, over fiscal 2008. This decrease was driven by
declining net revenues in all brands primarily due to the continued negative impact of the general economic
environment during fiscal 2009, which resulted in a comparable store sales decrease of 5.1%, as well as the
temporary and permanent closure of 11 stores and 23 stores, respectively. Additionally, our catalog and page
circulation decreased 16.4% and 21.1%, respectively (including the impact of our catalog circulation
optimization strategy). This revenue decrease was partially offset by 9 new store openings and the remodeling or
expansion of an additional 8 stores.
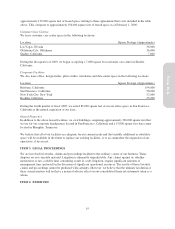
Net revenues for fiscal 2008 decreased by $583,462,000, or 14.8%, compared to fiscal 2007. This decrease was
primarily due to the downturn in the economic environment during fiscal 2008 resulting in a comparable store
sales decrease of 17.2%, the impact of the extra week of net revenues in fiscal 2007 (a 53-week year) of
approximately $70,000,000, the temporary and permanent closure of 21 stores and 4 stores, respectively and a
decrease in catalog and page circulation of 20.2% and 30.3%, respectively. This decrease was partially offset by
an increase in store leased square footage of 7.1% (including 29 new store openings and the remodeling or
expansion of an additional 23 stores).
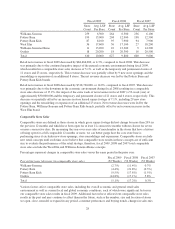
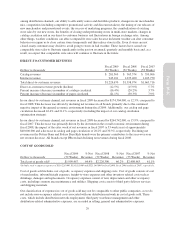
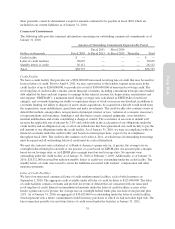
RETAIL REVENUES AND OTHER DATA
Dollars in thousands
Fiscal 2009
(52 Weeks)
Fiscal 2008
(52 Weeks)
Fiscal 2007
(53 Weeks)
Retail revenues $1,878,034 $1,962,498 $2,281,218
Retail revenue growth (decline) (4.3%) (14.0%) 5.9%
Comparable store sales growth (decline) (5.1%) (17.2%) 0.3%
Number of stores – beginning of year 627 600 588
Number of new stores 9 29 23
Number of new stores due to remodeling182326
Number of closed stores due to remodeling1(11) (21) (28)
Number of permanently closed stores (23) (4) (9)
Number of stores – end of year 610 627 600
Store selling square footage at year-end 3,763,000 3,828,000 3,575,000
Store leased square footage (“LSF”) at year-end 6,081,000 6,148,000 5,739,000
1Remodeled stores are defined as those stores temporarily closed and subsequently reopened during the year due to square footage
expansion, store modification or relocation.
27
Form 10-K