Pottery Barn 2009 Annual Report Download - page 53
Download and view the complete annual report
Please find page 53 of the 2009 Pottery Barn annual report below. You can navigate through the pages in the report by either clicking on the pages listed below, or by using the keyword search tool below to find specific information within the annual report.-
 1
1 -
2
-
3
-
4
-
5
-
6
-
7
-
8
-
9
-
10
-
11
-
12
-
13
-
14
-
15
-
16
-
17
-
18
-
19
-
20
-
21
-
22
-
23
-
24
-
25
-
26
-
27
-
28
-
29
-
30
-
31
-
32
-
33
-
34
-
35
-
36
-
37
-
38
-
39
-
40
-
41
-
42
-
 43
43 -
 44
44 -
 45
45 -
 46
46 -
 47
47 -
 48
48 -
 49
49 -
 50
50 -
 51
51 -
 52
52 -
 53
53 -
 54
54 -
 55
55 -
 56
56 -
 57
57 -
 58
58 -
 59
59 -
 60
60 -
 61
61 -
 62
62 -
 63
63 -
64
-
65
-
66
-
67
-
68
-
69
-
70
-
71
-
72
-
73
-
74
-
75
-
76
-
77
-
78
-
79
-
80
-
81
-
82
-
83
-
84
-
85
-
86
-
87
-
88
-
89
-
90
-
91
-
92
-
93
-
94
-
95
-
96
-
97
-
98
-
99
-
100
-
101
-
102
-
103
-
104
-
105
-
106
-
107
-
108
-
109
-
110
-
111
-
112
-
113
-
114
-
115
-
116
-
117
-
118
-
119
-
120
-
121
-
122
-
123
-
124
-
125
-
126
-
127
-
128
-
129
-
130
-
131
-
132
-
133
-
134
-
135
-
136
-
137
-
138
-
139
-
140
-
141
-
142
-
143
-
144
-
145
-
146
-
147
-
148
-
149
-
150
-
151
-
152
-
153
-
154
-
155
-
156
-
157
-
158
-
159
-
160
-
161
-
162
-
163
-
164
-
165
-
166
-
167
-
168
-
169
-
170
-
171
-
172
-
173
-
174
-
175
-
176
-
177
-
178
-
179
-
180
-
181
-
182
-
183
-
184
-
185
-
186
-
187
-
188
-
189
-
190
-
191
-
192
-
193
-
194
-
195
-
196
-
197
-
198
-
199
-
200
 |
 |

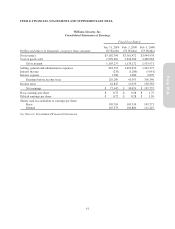
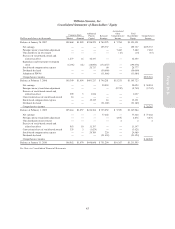
ITEM 8. FINANCIAL STATEMENTS AND SUPPLEMENTARY DATA
Williams-Sonoma, Inc.
Consolidated Statements of Earnings
Fiscal Year Ended
Dollars and shares in thousands, except per share amounts
Jan. 31, 2010
(52 Weeks)
Feb. 1, 2009
(52 Weeks)
Feb. 3, 2008
(53 Weeks)
Net revenues $3,102,704 $3,361,472 $3,944,934
Cost of goods sold 1,999,467 2,226,300 2,408,963
Gross margin 1,103,237 1,135,172 1,535,971
Selling, general and administrative expenses 981,795 1,093,019 1,222,573
Interest income (235) (1,280) (5,041)
Interest expense 1,388 1,480 2,099
Earnings before income taxes 120,289 41,953 316,340
Income taxes 42,847 11,929 120,583
Net earnings $ 77,442 $ 30,024 $ 195,757
Basic earnings per share $ 0.73 $ 0.28 $ 1.79
Diluted earnings per share $ 0.72 $ 0.28 $ 1.76
Shares used in calculation of earnings per share:
Basic 105,763 105,530 109,273
Diluted 107,373 106,880 111,447
See Notes to Consolidated Financial Statements.
41
Form 10-K