Pottery Barn 2009 Annual Report Download - page 56
Download and view the complete annual report
Please find page 56 of the 2009 Pottery Barn annual report below. You can navigate through the pages in the report by either clicking on the pages listed below, or by using the keyword search tool below to find specific information within the annual report.-
 1
1 -
2
-
3
-
4
-
5
-
6
-
7
-
8
-
9
-
10
-
11
-
12
-
13
-
14
-
15
-
16
-
17
-
18
-
19
-
20
-
21
-
22
-
23
-
24
-
25
-
26
-
27
-
28
-
29
-
30
-
31
-
32
-
33
-
34
-
35
-
36
-
37
-
38
-
39
-
40
-
41
-
42
-
43
-
44
-
45
-
 46
46 -
 47
47 -
 48
48 -
 49
49 -
 50
50 -
 51
51 -
 52
52 -
 53
53 -
 54
54 -
 55
55 -
 56
56 -
 57
57 -
 58
58 -
 59
59 -
 60
60 -
 61
61 -
 62
62 -
 63
63 -
 64
64 -
 65
65 -
 66
66 -
67
-
68
-
69
-
70
-
71
-
72
-
73
-
74
-
75
-
76
-
77
-
78
-
79
-
80
-
81
-
82
-
83
-
84
-
85
-
86
-
87
-
88
-
89
-
90
-
91
-
92
-
93
-
94
-
95
-
96
-
97
-
98
-
99
-
100
-
101
-
102
-
103
-
104
-
105
-
106
-
107
-
108
-
109
-
110
-
111
-
112
-
113
-
114
-
115
-
116
-
117
-
118
-
119
-
120
-
121
-
122
-
123
-
124
-
125
-
126
-
127
-
128
-
129
-
130
-
131
-
132
-
133
-
134
-
135
-
136
-
137
-
138
-
139
-
140
-
141
-
142
-
143
-
144
-
145
-
146
-
147
-
148
-
149
-
150
-
151
-
152
-
153
-
154
-
155
-
156
-
157
-
158
-
159
-
160
-
161
-
162
-
163
-
164
-
165
-
166
-
167
-
168
-
169
-
170
-
171
-
172
-
173
-
174
-
175
-
176
-
177
-
178
-
179
-
180
-
181
-
182
-
183
-
184
-
185
-
186
-
187
-
188
-
189
-
190
-
191
-
192
-
193
-
194
-
195
-
196
-
197
-
198
-
199
-
200
 |
 |

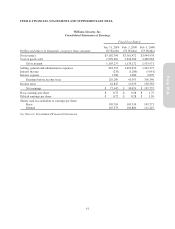
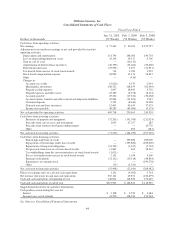
Williams-Sonoma, Inc.
Consolidated Statements of Cash Flows
Fiscal Year Ended
Dollars in thousands
Jan. 31, 2010
(52 Weeks)
Feb. 1, 2009
(52 Weeks)
Feb. 3, 2008
(53 Weeks)
Cash flows from operating activities:
Net earnings $ 77,442 $ 30,024 $ 195,757
Adjustments to reconcile net earnings to net cash provided by (used in)
operating activities:
Depreciation and amortization 151,796 148,083 140,701
Loss on disposal/impairment of assets 33,136 39,317 4,700
Gain on sale of asset — (16,115) —
Amortization of deferred lease incentives (36,799) (31,266) (29,400)
Deferred income taxes (23,595) 5,107 (31,951)
Tax benefit from exercise of stock-based awards 714 1,059 3,922
Stock-based compensation expense 24,989 12,131 26,812
Other — (416) —
Changes in:
Accounts receivable (6,620) 9,579 2,091
Merchandise inventories 108,332 118,679 (81,469)
Prepaid catalog expenses 3,647 18,483 4,702
Prepaid expenses and other assets 23,349 (8,578) (8,161)
Accounts payable 29,202 (27,532) (30,068)
Accrued salaries, benefits and other current and long-term liabilities 42,084 (24,361) 5,945
Customer deposits 2,353 (8,644) 13,458
Deferred rent and lease incentives 12,403 49,619 37,675
Income taxes payable 48,285 (85,006) (9,175)
Net cash provided by operating activities 490,718 230,163 245,539
Cash flows from investing activities:
Purchases of property and equipment (72,263) (191,789) (212,024)
Proceeds from sale of assets and investments 1,033 47,257 285
Proceeds from software developer reimbursement — — 14,770
Other — 493 (281)
Net cash used in investing activities (71,230) (144,039) (197,250)
Cash flows from financing activities:
Borrowings under line of credit — 195,800 189,000
Repayments of borrowings under line of credit — (195,800) (189,000)
Repayments of long-term obligations (14,702) (1,617) (2,703)
Net proceeds from exercise of stock-based awards 11,861 461 28,362
Tax withholdings from the conversion/release of stock-based awards (3,621) — —
Excess tax benefit from exercise of stock-based awards 2,131 1,034 5,100
Payment of dividends (51,132) (50,518) (48,863)
Repurchases of common stock — — (190,378)
Other (35) (1,520) —
Net cash used in financing activities (55,498) (52,160) (208,482)
Effect of exchange rates on cash and cash equivalents 1,131 (4,092) 3,714
Net increase (decrease) in cash and cash equivalents 365,121 29,872 (156,479)
Cash and cash equivalents at beginning of year 148,822 118,950 275,429
Cash and cash equivalents at end of year $513,943 $ 148,822 $ 118,950
Supplemental disclosure of cash flow information:
Cash paid/(received) during the year for:
Interest $ 3,198 $ 2,550 $ 3,484
Income taxes, net of refunds (8,593) 118,356 154,948
See Notes to Consolidated Financial Statements.
44