Pottery Barn 2009 Annual Report Download - page 69
Download and view the complete annual report
Please find page 69 of the 2009 Pottery Barn annual report below. You can navigate through the pages in the report by either clicking on the pages listed below, or by using the keyword search tool below to find specific information within the annual report.-
 1
1 -
2
-
3
-
4
-
5
-
6
-
7
-
8
-
9
-
10
-
11
-
12
-
13
-
14
-
15
-
16
-
17
-
18
-
19
-
20
-
21
-
22
-
23
-
24
-
25
-
26
-
27
-
28
-
29
-
30
-
31
-
32
-
33
-
34
-
35
-
36
-
37
-
38
-
39
-
40
-
41
-
42
-
43
-
44
-
45
-
46
-
47
-
48
-
49
-
50
-
51
-
52
-
53
-
54
-
55
-
56
-
57
-
58
-
 59
59 -
 60
60 -
 61
61 -
 62
62 -
 63
63 -
 64
64 -
 65
65 -
 66
66 -
 67
67 -
 68
68 -
 69
69 -
 70
70 -
 71
71 -
 72
72 -
 73
73 -
 74
74 -
 75
75 -
 76
76 -
 77
77 -
 78
78 -
 79
79 -
80
-
81
-
82
-
83
-
84
-
85
-
86
-
87
-
88
-
89
-
90
-
91
-
92
-
93
-
94
-
95
-
96
-
97
-
98
-
99
-
100
-
101
-
102
-
103
-
104
-
105
-
106
-
107
-
108
-
109
-
110
-
111
-
112
-
113
-
114
-
115
-
116
-
117
-
118
-
119
-
120
-
121
-
122
-
123
-
124
-
125
-
126
-
127
-
128
-
129
-
130
-
131
-
132
-
133
-
134
-
135
-
136
-
137
-
138
-
139
-
140
-
141
-
142
-
143
-
144
-
145
-
146
-
147
-
148
-
149
-
150
-
151
-
152
-
153
-
154
-
155
-
156
-
157
-
158
-
159
-
160
-
161
-
162
-
163
-
164
-
165
-
166
-
167
-
168
-
169
-
170
-
171
-
172
-
173
-
174
-
175
-
176
-
177
-
178
-
179
-
180
-
181
-
182
-
183
-
184
-
185
-
186
-
187
-
188
-
189
-
190
-
191
-
192
-
193
-
194
-
195
-
196
-
197
-
198
-
199
-
200
 |
 |
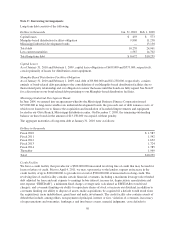
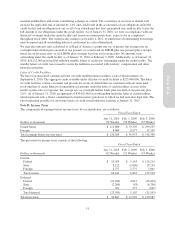
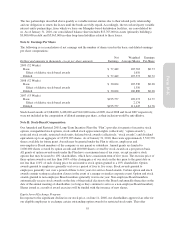
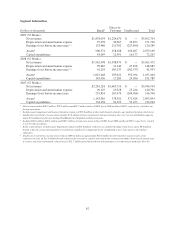
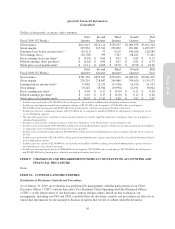
The following table summarizes information about stock options outstanding at January 31, 2010:
Stock Options Outstanding
Stock Options
Exercisable
Range of Exercise Prices
Number
Outstanding
Weighted Average
Contractual Term
Remaining (Years)
Weighted
Average
Exercise
Price
Number
Exercisable
Weighted
Average
Exercise
Price
$ 8.31 – $ 13.66 662,188 0.73 $11.75 662,188 $11.75
$ 13.85 – $ 21.80 792,536 1.80 18.31 792,536 18.31
$ 22.25 – $ 32.39 649,808 3.17 26.62 649,808 26.62
$ 32.80 – $ 41.94 506,600 4.73 37.08 466,780 36.93
$ 41.99 – $ 41.99 2,000 5.97 41.99 1,600 41.99
$ 8.31 – $ 41.99 2,613,132 2.44 $22.37 2,572,912 $22.11
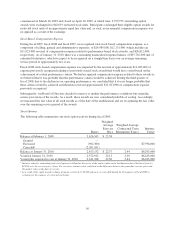
Stock-Settled Stock Appreciation Rights
A stock-settled stock appreciation right is an award that allows the recipient to receive common stock equal to
the appreciation in the fair market value of our common stock between the date the award was granted and the
conversion date for the number of shares vested.
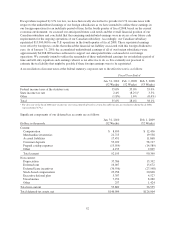
The following table summarizes our stock-settled stock appreciation right activity during fiscal 2009:
Shares
Weighted
Average
Conversion
Price1
Weighted Average
Contractual Term
Remaining (Years)
Intrinsic
Value2
Balance at February 1, 2009 7,611,514 $18.67
Granted (weighted average fair value of $8.06) 25,000 19.14
Converted (348,375) $ 4,492,000
Canceled3(2,740,164)
Balance at January 31, 2010 4,547,975 $13.40 8.44 $38,353,000
Vested at January 31, 2010 1,335,855 $21.05 7.88 $ 7,215,000
Vested plus expected to vest at January 31, 2010 3,946,162 $13.95 8.40 $32,429,000
1Conversion price is defined as the price from which stock-settled stock appreciation rights are measured and is equal to the market value
on the date of grant.
2Intrinsic value for outstanding and vested rights is defined as the excess of the current market value on the last business day of the fiscal
year (or $18.98) over the conversion price, if any. For conversions, intrinsic value is defined as the difference between the conversion price
and the market value on the date of the conversion.
3As a result of the equity award exchange program, a total of 1,845,115 stock-settled stock appreciation rights were cancelled during the
first quarter of fiscal 2009 in exchange for the issuance of restricted stock units.
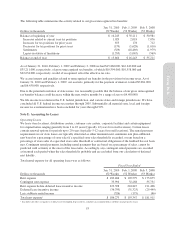
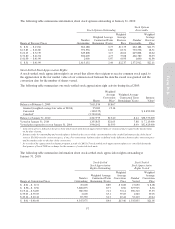
The following table summarizes information about stock-settled stock appreciation rights outstanding at
January 31, 2010:
Stock-Settled
Stock Appreciation
Rights Outstanding
Stock-Settled
Stock Appreciation
Rights Vested
Range of Conversion Prices
Number
Outstanding
Weighted Average
Contractual Term
Remaining (Years)
Weighted
Average
Conversion
Price
Number
Vested
Weighted
Average
Conversion
Price
$ 8.01 – $ 8.31 70,600 8.89 $ 8.08 17,650 $ 8.08
$ 8.56 – $ 8.56 3,606,875 8.77 8.56 673,925 8.56
$ 19.14 – $ 34.89 780,550 7.12 33.14 590,310 33.93
$ 39.05 – $ 39.05 2,600 6.31 39.05 1,560 39.05
$ 40.44 – $ 40.44 87,350 6.12 40.44 52,410 40.44
$ 8.01 – $ 40.44 4,547,975 8.44 $13.40 1,335,855 $21.05
57
Form 10-K