Pottery Barn 2009 Annual Report Download - page 68
Download and view the complete annual report
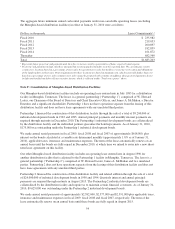
Please find page 68 of the 2009 Pottery Barn annual report below. You can navigate through the pages in the report by either clicking on the pages listed below, or by using the keyword search tool below to find specific information within the annual report.-
 1
1 -
2
-
3
-
4
-
5
-
6
-
7
-
8
-
9
-
10
-
11
-
12
-
13
-
14
-
15
-
16
-
17
-
18
-
19
-
20
-
21
-
22
-
23
-
24
-
25
-
26
-
27
-
28
-
29
-
30
-
31
-
32
-
33
-
34
-
35
-
36
-
37
-
38
-
39
-
40
-
41
-
42
-
43
-
44
-
45
-
46
-
47
-
48
-
49
-
50
-
51
-
52
-
53
-
54
-
55
-
56
-
57
-
 58
58 -
 59
59 -
 60
60 -
 61
61 -
 62
62 -
 63
63 -
 64
64 -
 65
65 -
 66
66 -
 67
67 -
 68
68 -
 69
69 -
 70
70 -
 71
71 -
 72
72 -
 73
73 -
 74
74 -
 75
75 -
 76
76 -
 77
77 -
 78
78 -
79
-
80
-
81
-
82
-
83
-
84
-
85
-
86
-
87
-
88
-
89
-
90
-
91
-
92
-
93
-
94
-
95
-
96
-
97
-
98
-
99
-
100
-
101
-
102
-
103
-
104
-
105
-
106
-
107
-
108
-
109
-
110
-
111
-
112
-
113
-
114
-
115
-
116
-
117
-
118
-
119
-
120
-
121
-
122
-
123
-
124
-
125
-
126
-
127
-
128
-
129
-
130
-
131
-
132
-
133
-
134
-
135
-
136
-
137
-
138
-
139
-
140
-
141
-
142
-
143
-
144
-
145
-
146
-
147
-
148
-
149
-
150
-
151
-
152
-
153
-
154
-
155
-
156
-
157
-
158
-
159
-
160
-
161
-
162
-
163
-
164
-
165
-
166
-
167
-
168
-
169
-
170
-
171
-
172
-
173
-
174
-
175
-
176
-
177
-
178
-
179
-
180
-
181
-
182
-
183
-
184
-
185
-
186
-
187
-
188
-
189
-
190
-
191
-
192
-
193
-
194
-
195
-
196
-
197
-
198
-
199
-
200
 |
 |

commenced on March 16, 2009 and closed on April 10, 2009, at which time, 2,979,735 outstanding option
awards were exchanged for 842,019 restricted stock units. Participants exchanged their eligible option awards for
restricted stock units of an approximate equal fair value and, as such, no incremental compensation expense was
recognized as a result of the exchange.
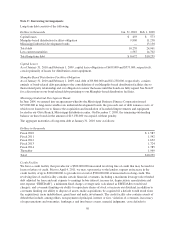
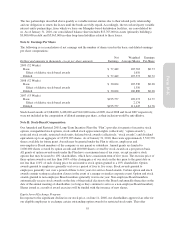
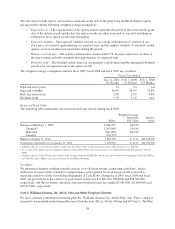
Stock-Based Compensation Expense
During fiscal 2009, fiscal 2008 and fiscal 2007, we recognized total stock-based compensation expense, as a
component of selling, general and administrative expenses, of $24,989,000, $12,131,000 (which includes an
$11,023,000 reversal of compensation expense related to performance-based stock awards), and $26,812,000,
respectively. As of January 31, 2010, there was a remaining unamortized expense balance of $35,716,000 (net of
estimated forfeitures), which we expect to be recognized on a straight-line basis over an average remaining
service period of approximately two years.
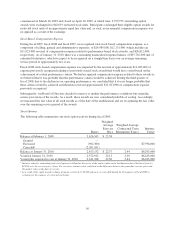
Fiscal 2008 stock-based compensation expense was impacted by the reversal of approximately $11,023,000 of
expense previously recognized relating to previously issued stock awards that would have vested based on the
achievement of certain performance criteria. We had recognized compensation expense related to these awards as
we believed that it was probable that the performance criteria would be achieved. During the third quarter of
fiscal 2008, due to the decline in our operating performance, we concluded that it was no longer probable that
these criteria would be achieved and therefore reversed approximately $11,023,000 of compensation expense
previously recognized.
Subsequently, our Board of Directors decided to remove or modify the performance conditions but retain the
service provisions of the awards. As a result, these awards are now considered probable of vesting. Accordingly,
we measured the fair value of all such awards as of the date of the modification and are recognizing the fair value
over the remaining service period of the awards.
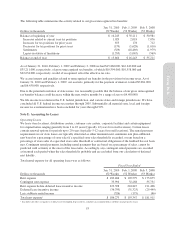
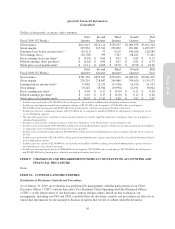
Stock Options
The following table summarizes our stock option activity during fiscal 2009:
Shares
Weighted
Average
Exercise
Price
Weighted Average
Contractual Term
Remaining (Years)
Intrinsic
Value1
Balance at February 1, 2009 5,626,543 $ 23.58
Granted —
Exercised (962,380) $7,936,000
Canceled2(2,051,031)
Balance at January 31, 2010 2,613,132 $ 22.37 2.44 $6,243,000
Vested at January 31, 2010 2,572,912 22.11 2.39 $6,243,000
Vested plus expected to vest at January 31, 2010 2,611,248 22.36 2.44 $6,243,000
1Intrinsic value for outstanding and vested options is defined as the excess of the market value on the last business day of the fiscal year (or
$18.98) over the exercise price, if any. For exercises, intrinsic value is defined as the difference between the grant date exercise price and
the market value on the date of exercise.
2As a result of the equity award exchange program, a total of 1,134,620 options were cancelled during the first quarter of fiscal 2009 in
exchange for the issuance of restricted stock units.
56